https://doi.org/10.3897/ab.e98875 (23 Dec 2022)


- ContentsContents
- Book InfoBook Info
- CiteCite
- MetricsMetrics
- CommentComment
- RelatedRelated
- FigsFigs
- TabsTabs
- TaxaTaxa
- RefsRefs
- CitedCited

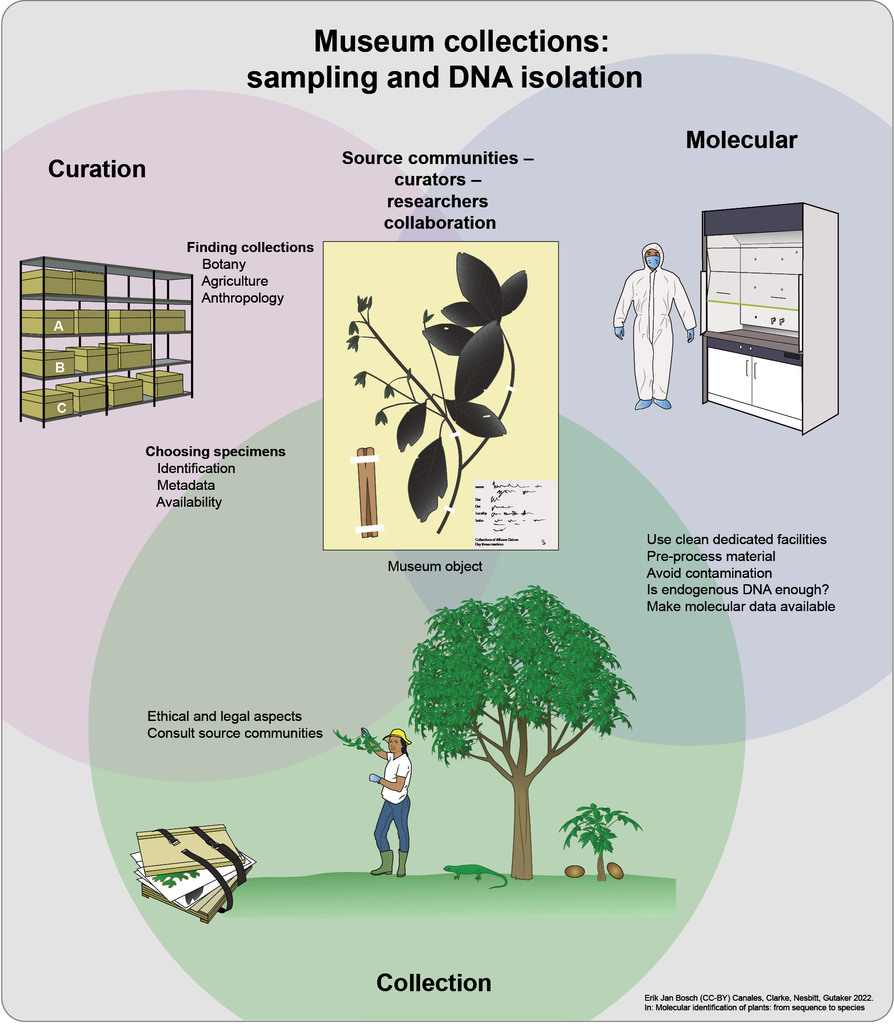
Chapter 2 Infographic: Overview of sampling and obtaining DNA from museum collections. An team effort of communities, curators and researchers (1) Collection of botanical material should have detailed consideration of its ethical and legal aspects and the consultation of source communities in advance, in accordance with CITES, CBD and Nagoya legal and ethical frameworks. (2) Curated botanical samples can be found in different types of museums that include botanic gardens, ethnobotany and anthropological collections. The next step is to find relevant specimens with preferably rich metadata, e.g. species identification, collection place and date. (3) Once the specimens have been identified, they should undergo molecular analyses in clean facilities. Where they will be pre-processed according to their traits, avoiding contamination with other samples, “modern” specimens, and amplicons. Then, it is crucial to identify samples that failed and passed quality controls for endogenous DNA. Finally, the data produced should be linked to their respective vouchers and made available in public repositories like NCBI and BOLD.

Chapter 3 Infographic: Summary of steps from field collection of water samples to DNA extraction in the laboratory. (1) Open or closed (encapsulated/cartridge) filters can be used for filtering water samples on-site. Large filters (e.g., plankton net with 60 μm pore size) are preferred for filtering larger volumes of water, while small pore size filters can usually process a few litres. Closed filters offer the advantage of preventing contamination, therefore they are more commonly used for on-site filtration. (2) Degradation is another important issue that should be prevented until DNA extraction. Water or filter samples can either be preserved in a chemical buffer or transported in cold and dark conditions to the laboratory for further processing. (3) Plant DNA in water samples can be captured by filtration or precipitation. When using filtration, samples are usually incubated in a lysis solution to extract DNA, while in precipitation samples are mixed with ethanol and DNA is collected in the pellet. Commercial DNA isolation kits specifically designed for environmental sample types are commonly used with some small modifications.

Chapter 4 Infographic: From leaf DNA to soil environmental DNA. One of the ways in which plant DNA is deposited in soil surfaces is through the accumulation of fallen leaves from trees.
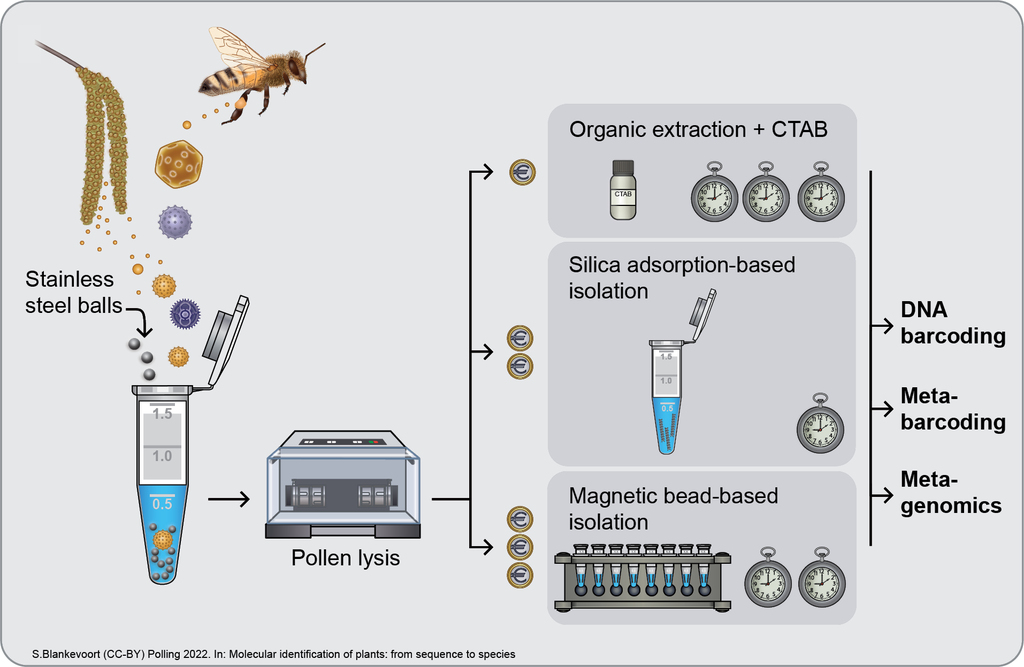
Chapter 5 Infographic: Overview of pollen sources, DNA extraction, and downstream analytical methods for the molecular identification of plants from pollen DNA.


Schematic overview of DNA degradation processes (hydrolysis, oxidation, alkylation and Maillard reaction) that can cause DNA damage in the form of cleavage, base modifications or cross-links. The major mechanism leading to miscoding lesions in aDNA is the hydrolysis of cytosine to uracil, which leads to G to A and C to T substitutions by DNA polymerases, whereas blocking lesions can obstruct the movement of DNA polymerases during PCR (

Simplified overview of the sedaDNA research process, including some of the major challenges and potential solutions indicated at each step.

Common DNA extraction steps: (1) samples are first homogenized using a sterile scalpel and later on go through a step, in which either (2a) extracellular DNA is washed off the sedimentary matrix (

Chapter 8 Infographic: Visual representation of the content of this chapter. Top left image based on Pederson et al. (2015).


: DNA barcoding of plants encompasses two streams of data from organism to DNA, one for the query sequence that should be identified and one for the reference sequence that is part of the reference library for identification. DNA source, marker choice, primer choice, sequencing approach and identification strategy all influence the ability and resolution of identification.


An example of standard output curves of an HRM analysis. In both A and B, the three phases of the DNA melting profile are shown. (1) The pre-melting phase is characterised by an initial fluorescence given in relative fluorescence units (RFUs). Here all PCR products are double-stranded and the maximum amount of dye is bound. (2) In the active melting phase the inflection point (i.e., Tm) is where 50% of the PCR product the samples is denatured. (3) The post-melting phase. As the temperature increases, the PCR products denature, dye is released, and the fluorescent signal drops and plateaus A. A normalised melting curve with indication of the inflection point. B. A derivative curve, which shows the inflection point on the slope as a melting peak.

Chapter 13 Infographic: Illustration of a typical HRM methodology workflow. The initial substrate can be a single or multi-ingredient product from raw or processed plant material. Following DNA extraction, taxon-specific primers are developed based on DNA barcodes or other molecular markers and tested in silico. An intercalating fluorescent dye is added to the PCR reaction, which allows the detection of the PCR amplicons by the HRM equipment during the melting process. The output consists of melting graphs and a statistical report including Genotype Confidence Percentages (GCPs) allowing accurate discrimination between the reference and the analysed taxa.


Schematic representation of tiling. The reference sequence at the top represents a hypothetical 800 bp exon with dotted blue lines indicating the intron-exon boundaries. Hypothetical baits are 80 bp long. This example is based on a 3x tiling strategy where each nucleotide is (on average) covered by three unique baits. The bait coverage decreases towards the ends of the exon as the target design of this hypothetical example did not include introns or intergenic regions.


Chapter 15 Infographic: Overview scheme of transcriptomics in plants with emphasis on the RNA-seq method. (a) Sample preparation and RNA isolation. (b) Library preparation starts by selecting the RNA species from the total RNA, followed by fragmentation of the RNA sequence, cDNA synthesis, adapter ligation, cDNA amplification, and RNA sequencing. (c) The first step in transcriptome analysis is assessing the quality and quantity of reads. The clean reads are assembled to the reference genome or through a de-novo assembly or by combining these two approaches. The assemble reads are then annotated, followed by quantification and normalisation of the annotated results. The final step is differential expression analysis to quantify the difference in the expression level of genes between the samples or treatments.


A. Genealogy of a sample of 4 genes (N = 4, in red) in a population of 8 genes at the present time, back to a common ancestor. B. Genealogy of the 4 sampled extant alleles (in red) back to the most recent common ancestor, with three coalescent events (in blue).


Chapter 22 Infographic: Visual representation of methodological steps for molecular identification of medicinal plants.

Chapter 23 Infographic: From farm to fork: risks along the herbal product supply chain. An example of potential risks and their sources in the supply chain chain for commercially-based dried plant products (e.g., herbal tea, spices, medicinal mixtures). The most common food safety risks associated with every step in the supply chain are highlighted in boxes, and the critical risk assessment steps are highlighted in the process (indicated by a magnifying glass and an exclamation mark).

Chapter 25 Infographic: Global wildlife trade hotspots and some examples of traded plants from those areas, and their respective uses (ornamental, medicinal, or timber).
