|
||
|
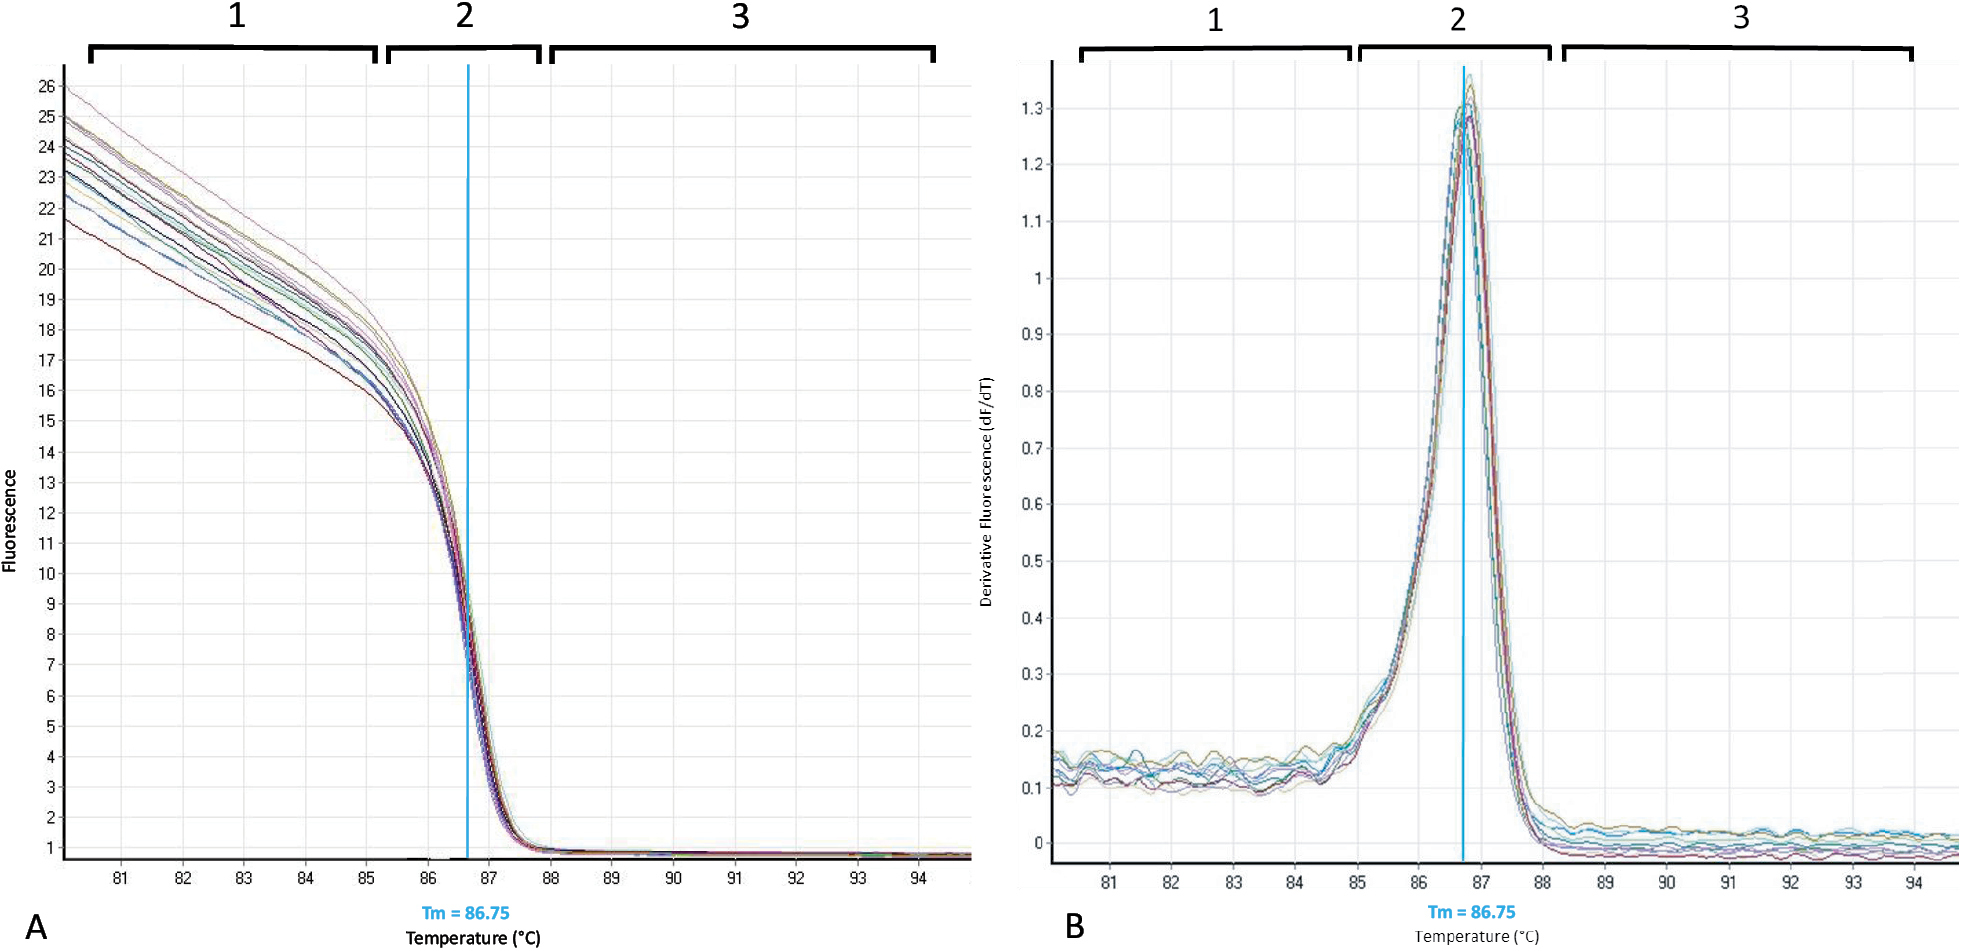
An example of standard output curves of an HRM analysis. In both A and B, the three phases of the DNA melting profile are shown. (1) The pre-melting phase is characterised by an initial fluorescence given in relative fluorescence units (RFUs). Here all PCR products are double-stranded and the maximum amount of dye is bound. (2) In the active melting phase the inflection point (i.e., Tm) is where 50% of the PCR product the samples is denatured. (3) The post-melting phase. As the temperature increases, the PCR products denature, dye is released, and the fluorescent signal drops and plateaus A. A normalised melting curve with indication of the inflection point. B. A derivative curve, which shows the inflection point on the slope as a melting peak. |