|
||
|
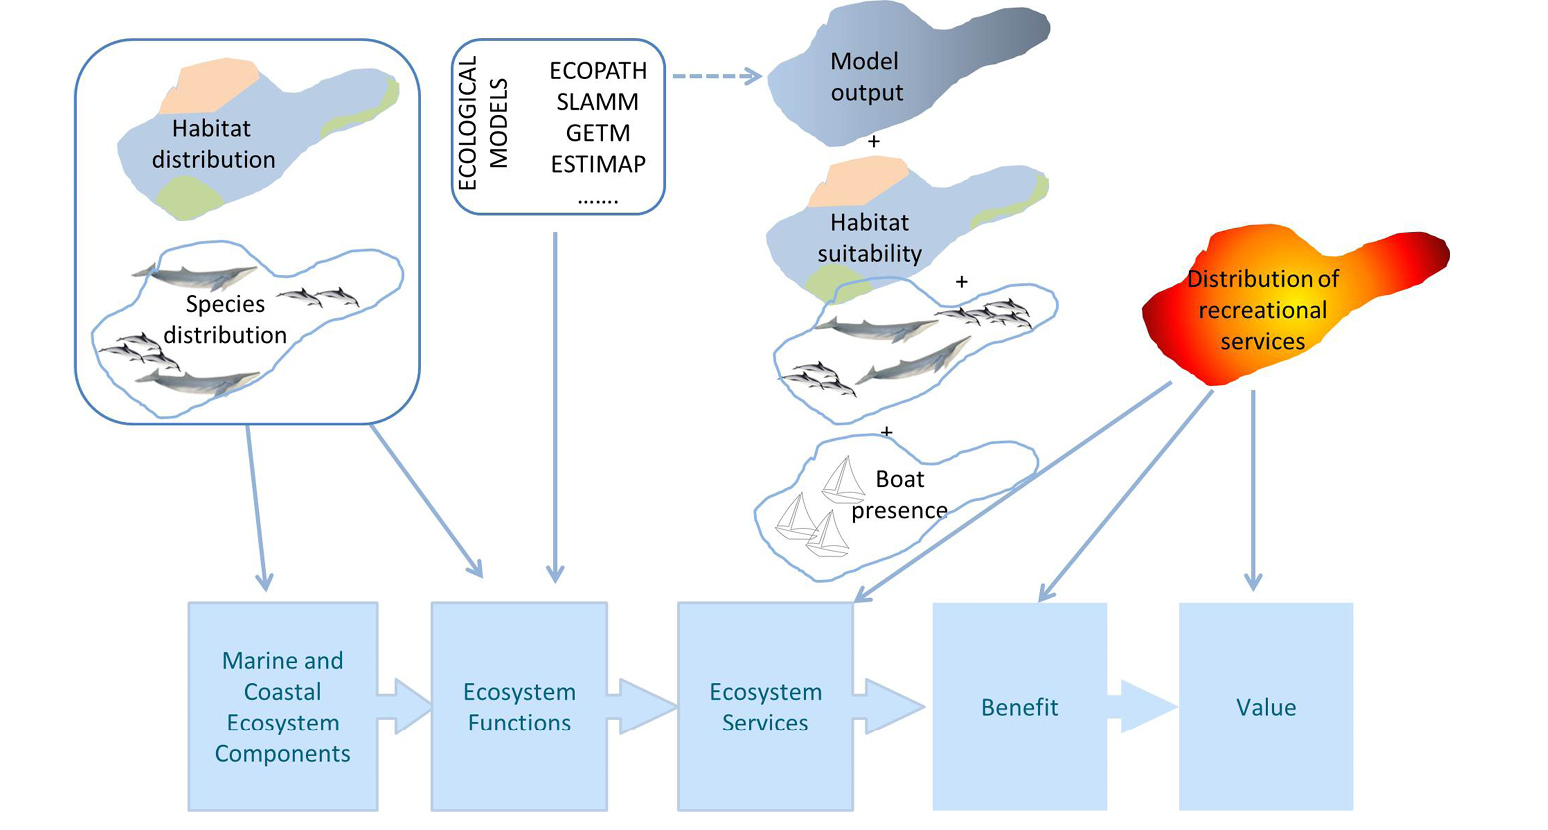
The figure depicts the way data and ecological models contribute to the different components of a basic ecosystem service generation framework (ES cascade at the bottom of the figure) in order to generate ES maps. In an example of whale watching tourism as an ES provided by whales, species and habitat distribution models are used to describe the basic ES components. Then models are used to describe the ecosystem functions. The outputs of all these models are then combined along with socio-economic parameters (in the example we refer to the number of whale watchers, but it could also be revenues from whale watching) in order to generate a final map of the benefit or value from whale-watching tourism. The arrows show the flow of information within the elements of the ES cascade. |