|
||
|
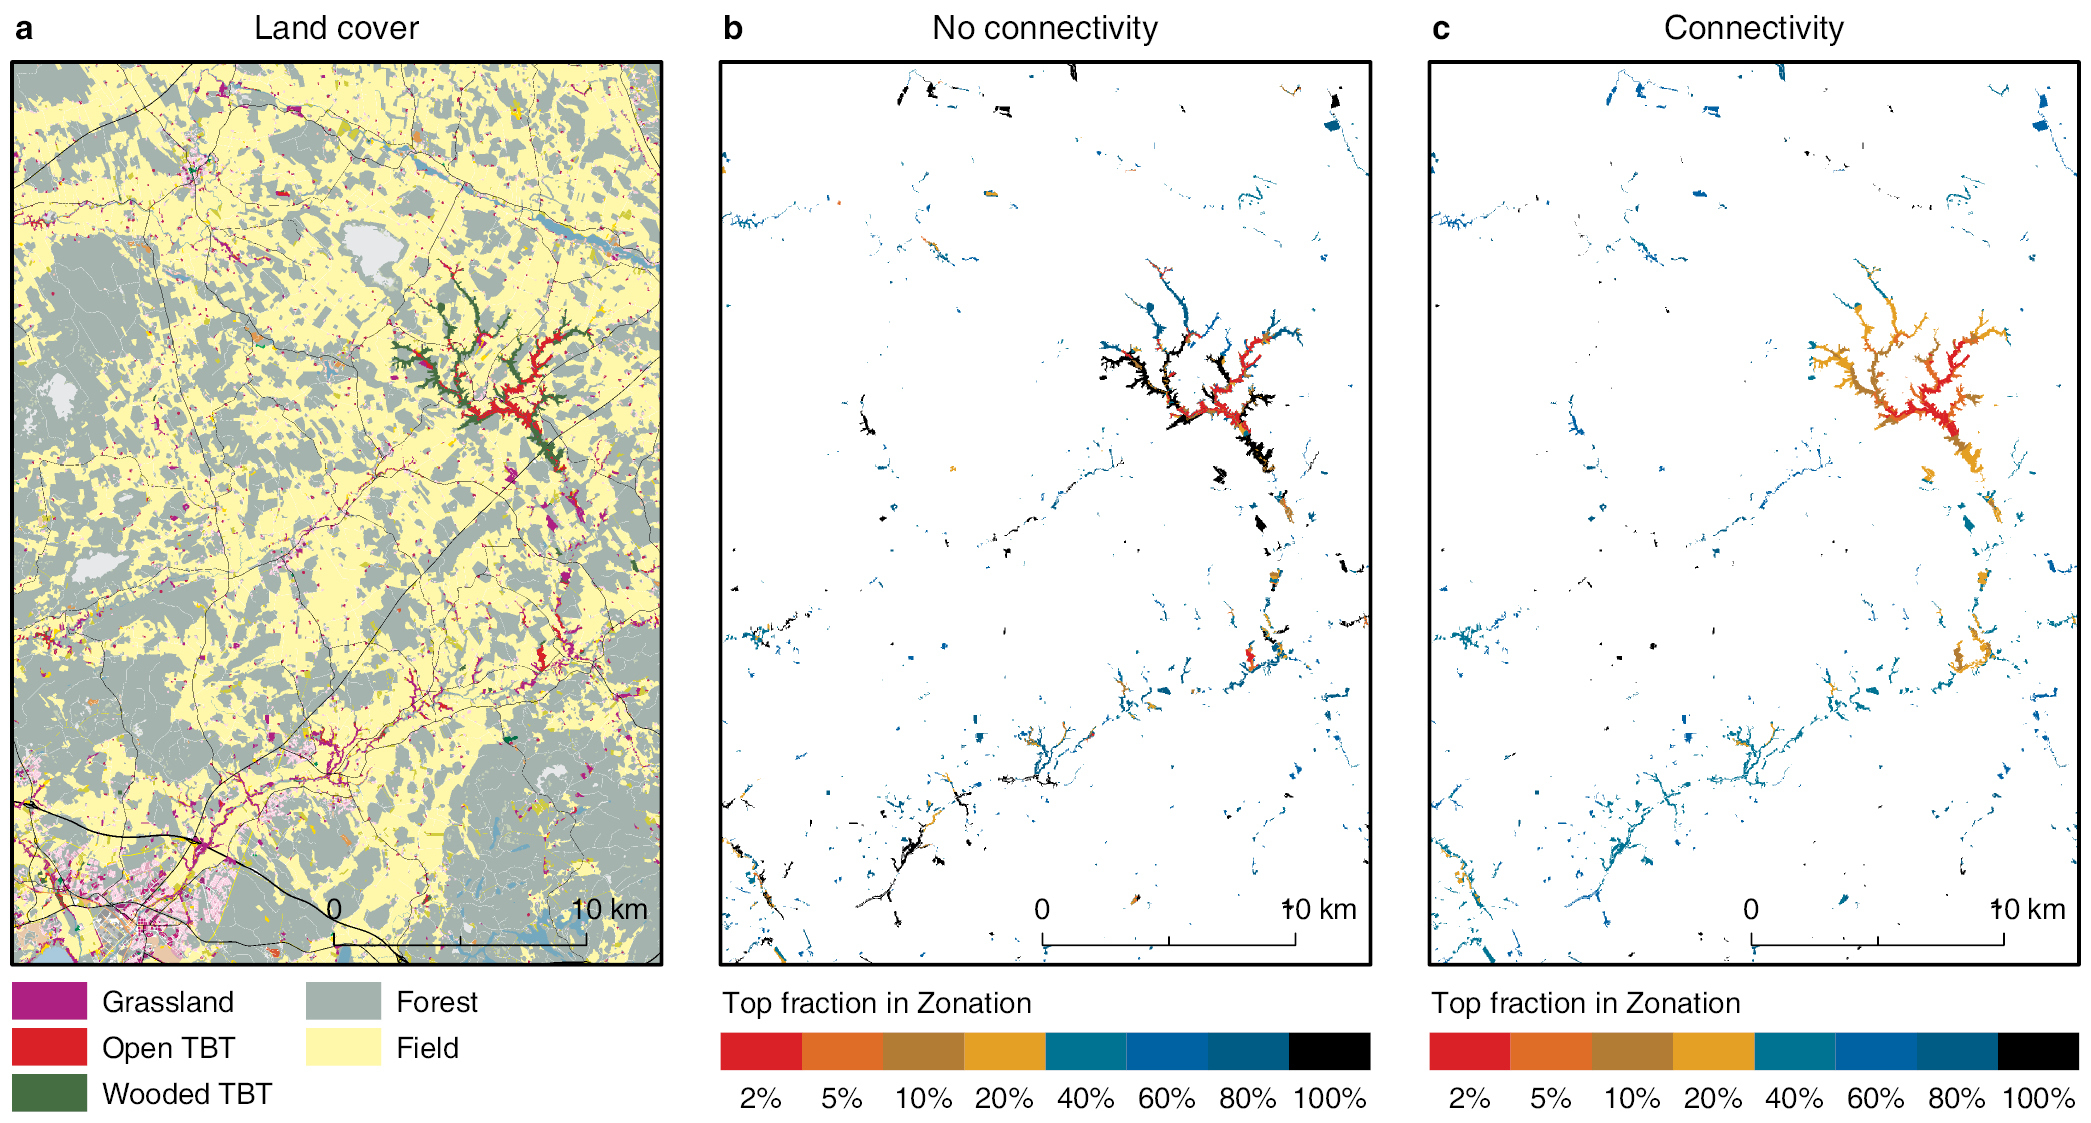
Land cover (a) and priority rank maps (b-c). The land cover map shows the locations of open and wooded traditional biotope (TBT) sites, and broad land cover categories for the surrounding landscape (b). The colours in (b-c) indicate high (red tones) and low (black) conservation priority: e.g. the best 2% of the landscape are in bright red. The maps are shown only for a small subsection or our study region because the grassland sites are very small and scattered, and would show poorly on a full map of the region. (b) is the solution without connectivity, and in (c) we have used the distribution smoothing feature in Zonation, where a 2 km kernel was used for calculating a smoothed conservation value of the raster cells to ensure connectivity between valuable sites. |