|
||
|
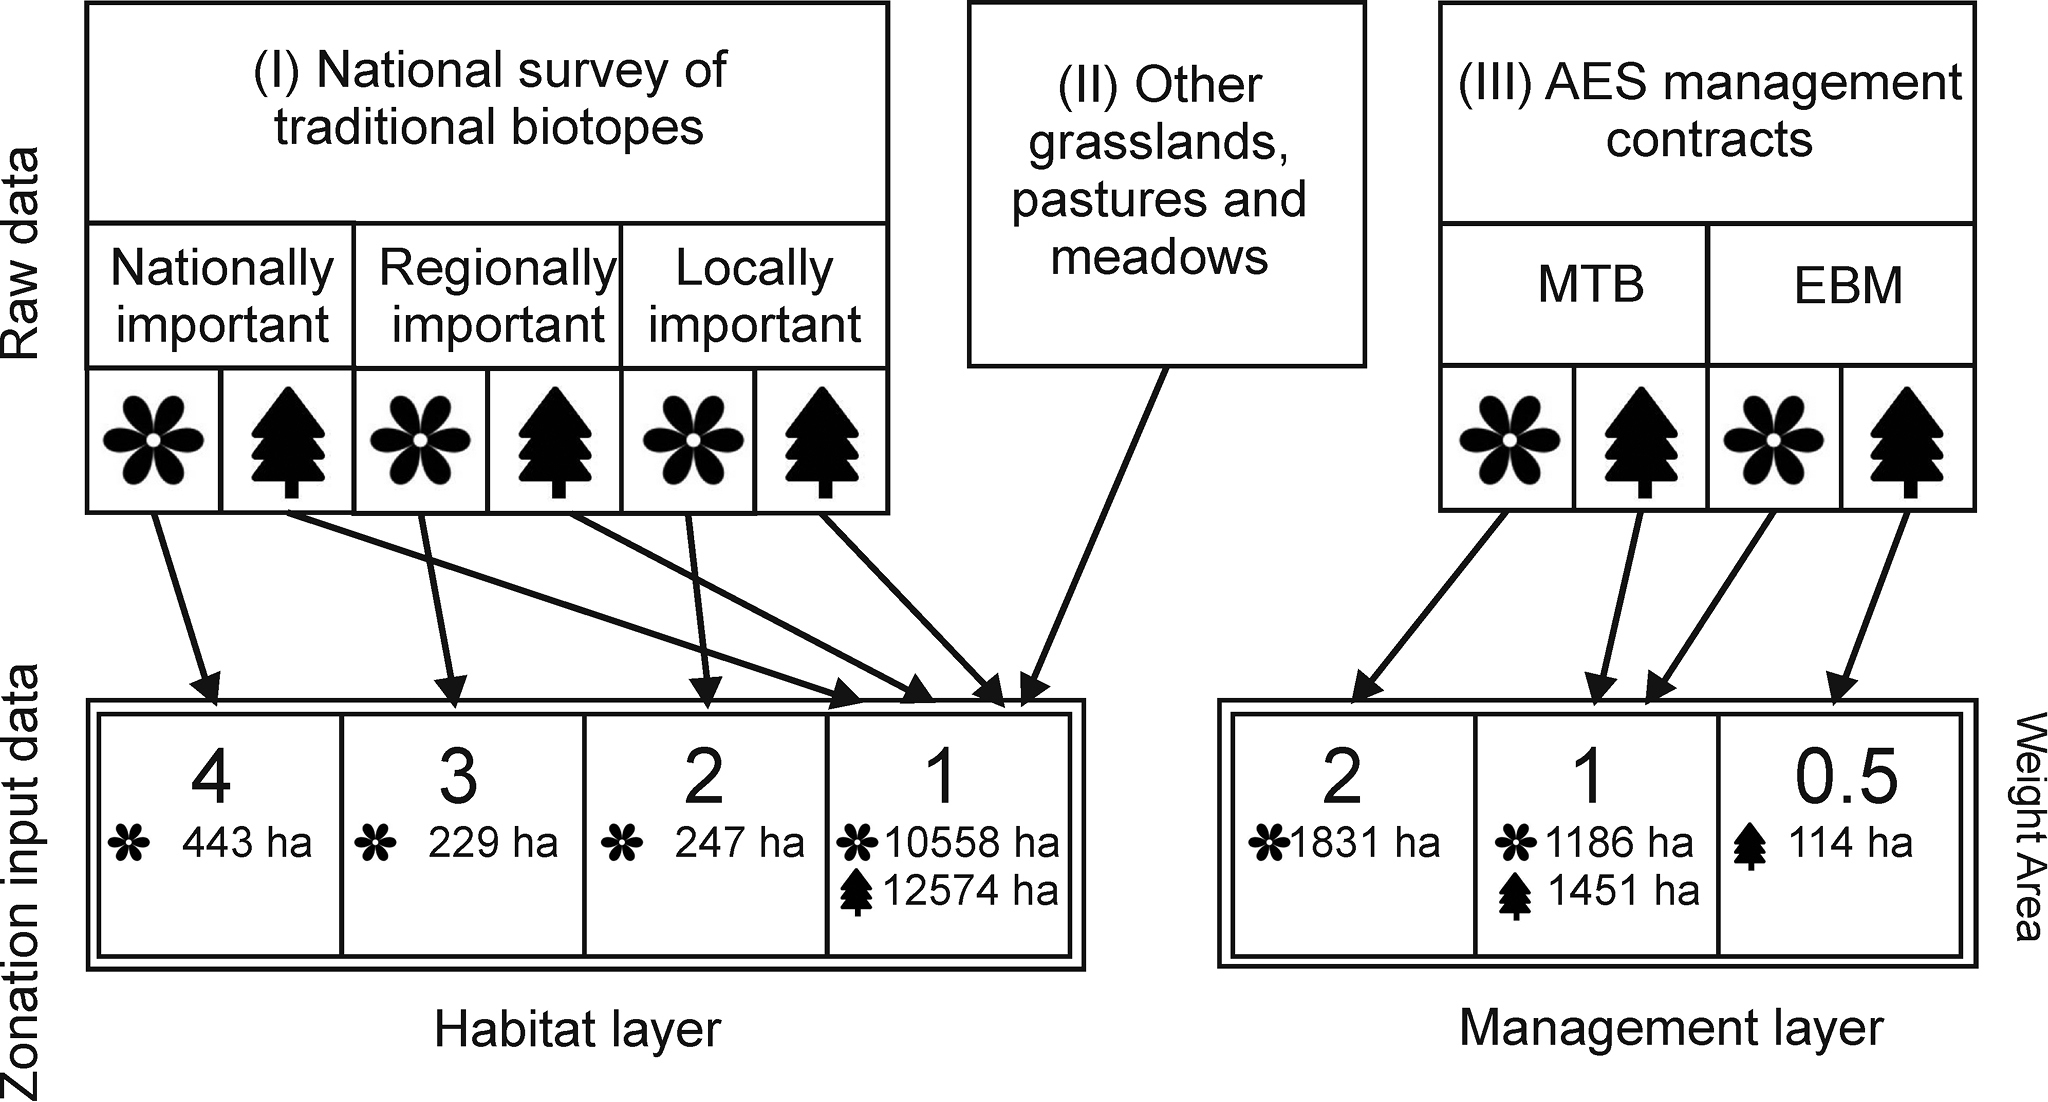
Descriptions of the input data. The upper part describes the raw data (I–III) used to derive two input layers to Zonation, described in the lower part. In the input layers the large numbers indicate weights given to those cells based on their assumed conservation value. The flower symbols indicate open sites, and the trees indicate wooded sites that were considered of lower conservation value currently, but were included with lower weights because they have potential for restoration and importance for improving connectivity of the network. |