|
||
|
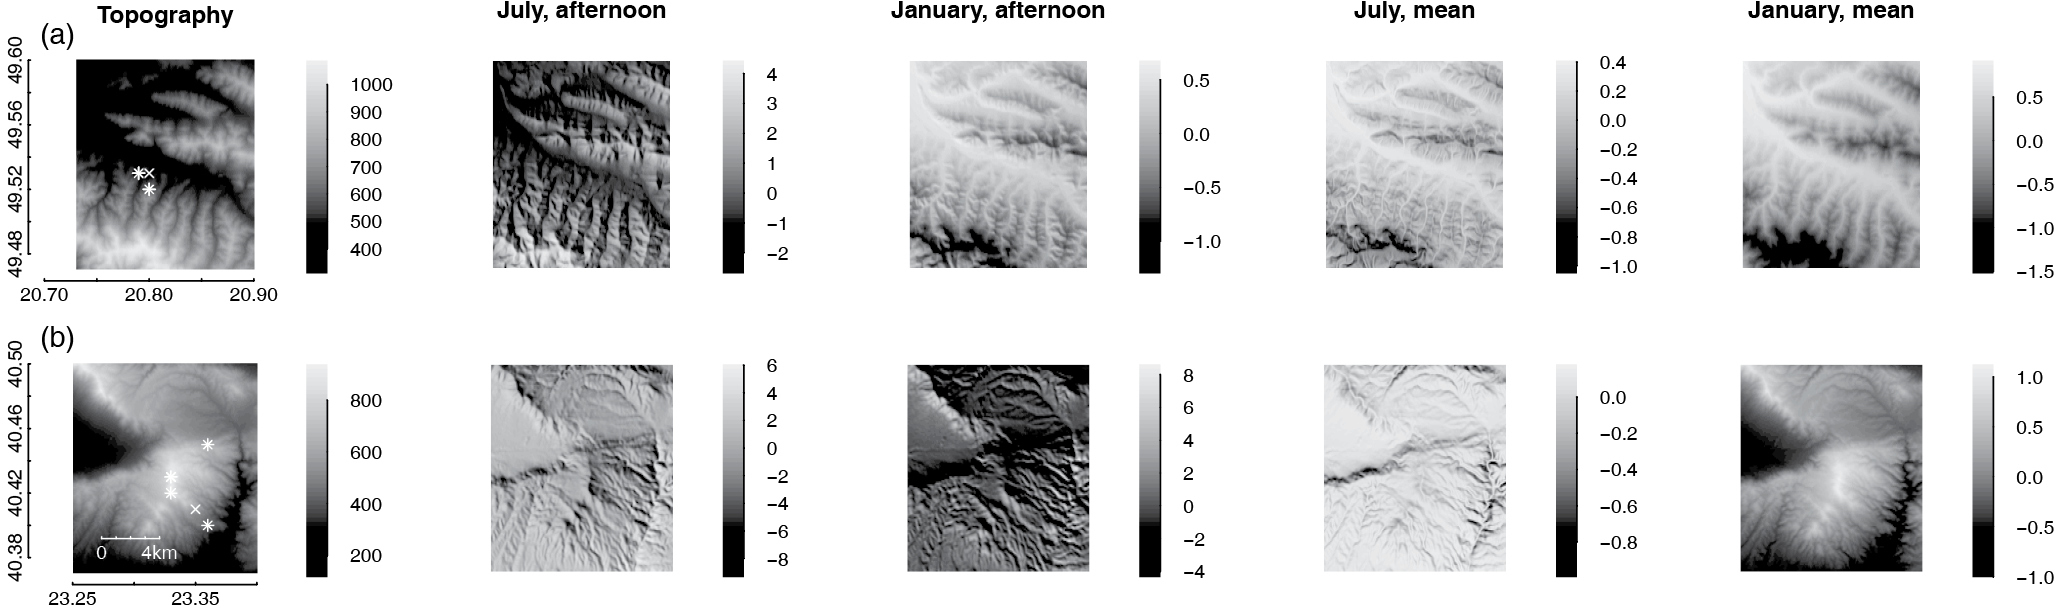
Effects of solar radiation on predicted ground temperatures in open landscapes. Maps in the first column show topography (elevation in m; axes indicating longitude and latitude). The following maps show the same areas with predicted effects of radiation on temperatures (in degrees Celsius) at 13:30 on a sunny day in July 2010 (second column) and January 2010 (third column), and effects on mean temperatures in mid-July 2010 (fourth column) and mid-January 2010 (fifth column). The first row of maps shows a site in Poland (compare Figure 4c) and the second row, a site in Greece (compare Figure 4e). |