|
||
|
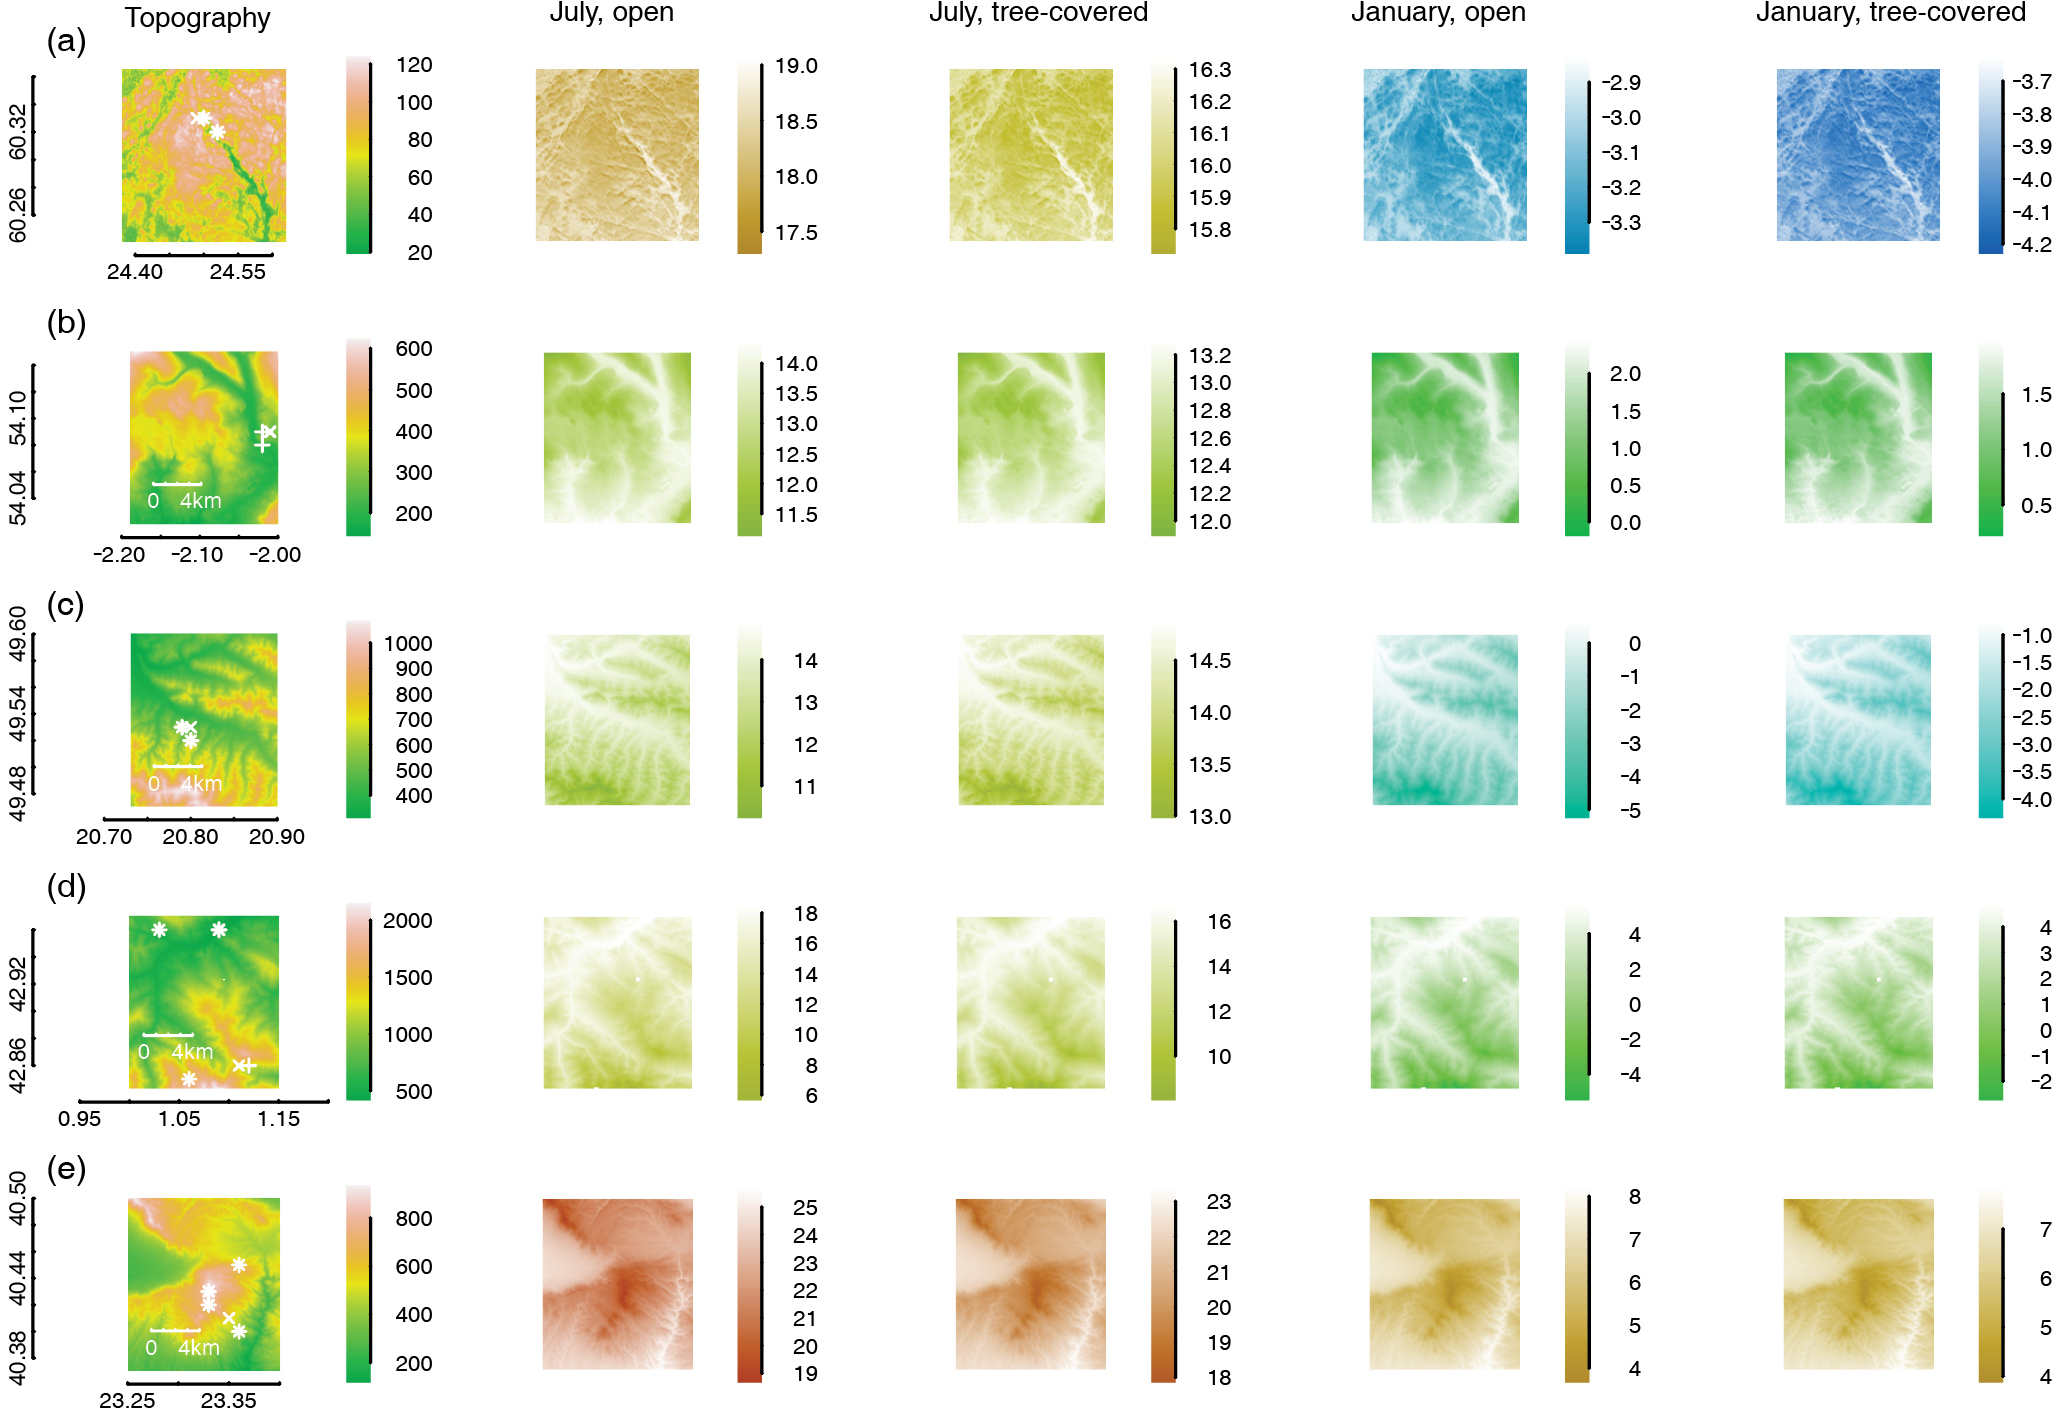
Maps of 5 areas containing microsites where temperature sensors were located, with predicted mean temperatures for the whole landscape. Maps in the first column show topography, with axes indicating longitude and latitude, and crosses at the locations where temperature sensors were buried (“?” for open sites and “+” for tree-covered sites). The following maps within each row show the same areas with predicted monthly mean temperatures, in degrees Celsius. Predictions are made for July 2010, for an open landscape (second column) and a tree-covered landscape (third column), and for January 2010, for an open landscape (fourth column) and a tree-covered landscape (fifth column). The rows cover sites in (a) southern Finland, (b) northern England, (c) southern Poland, (d) southern France and (e) Greece. The resolution of these maps is about 30 m. |