|
||
|
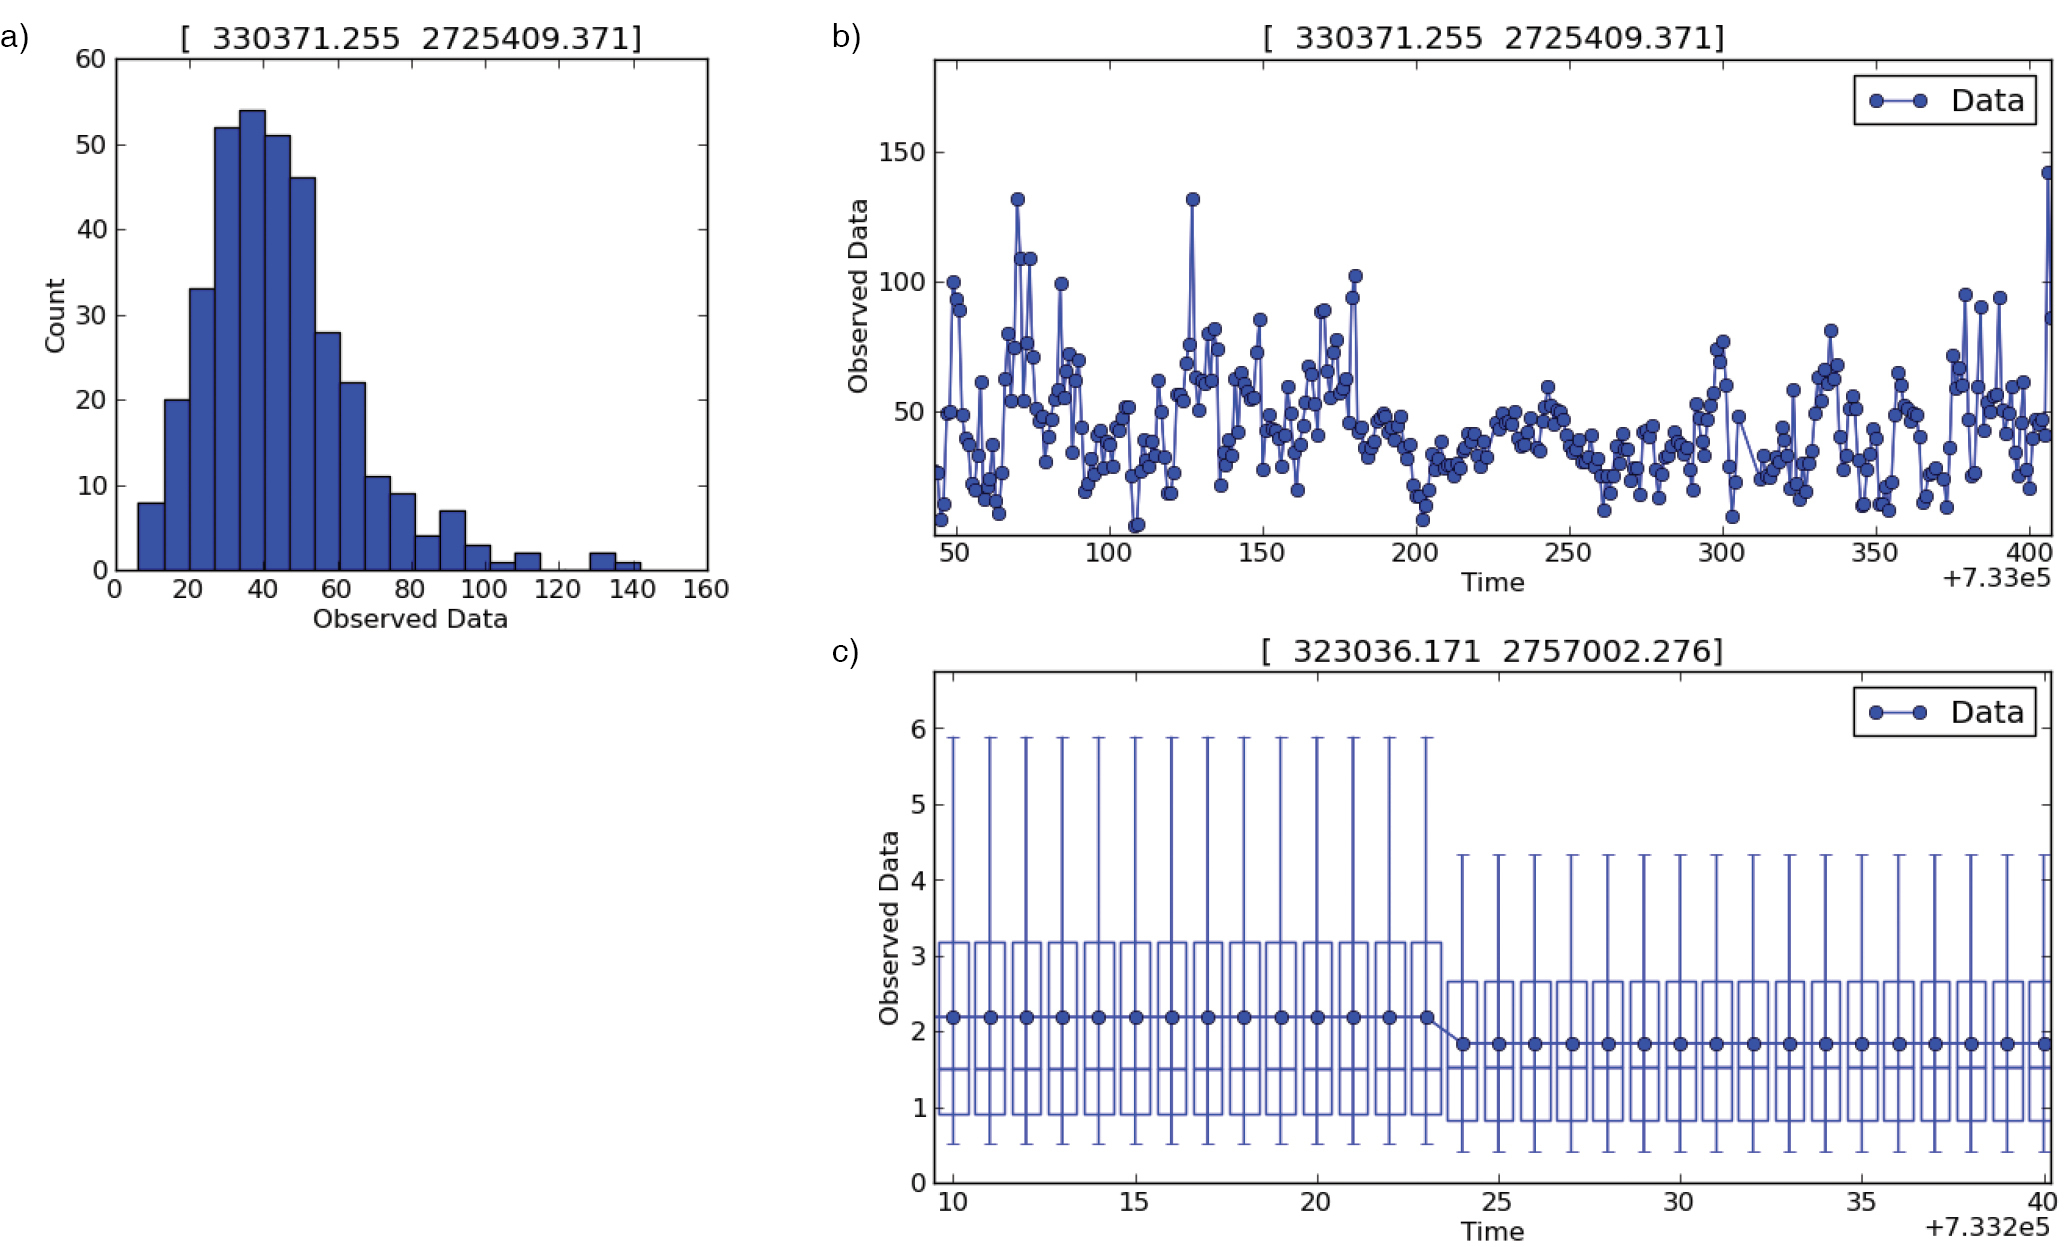
Data views for the space-time data during 1/1/2007–12/31/2007: (a) Histogram view at Dongshan station, (b) Time series view of hard data at Dongshan station, and (c) Time series view of soft data at the spatial coordinate [323036.171, 2757002.276] during 6/17/2007–7/17/2007, where the boxplot is used to depict data quantiles at [5, 25, 50, 75, 95], and the point presents the mean of the uncertain observations. |