|
||
|
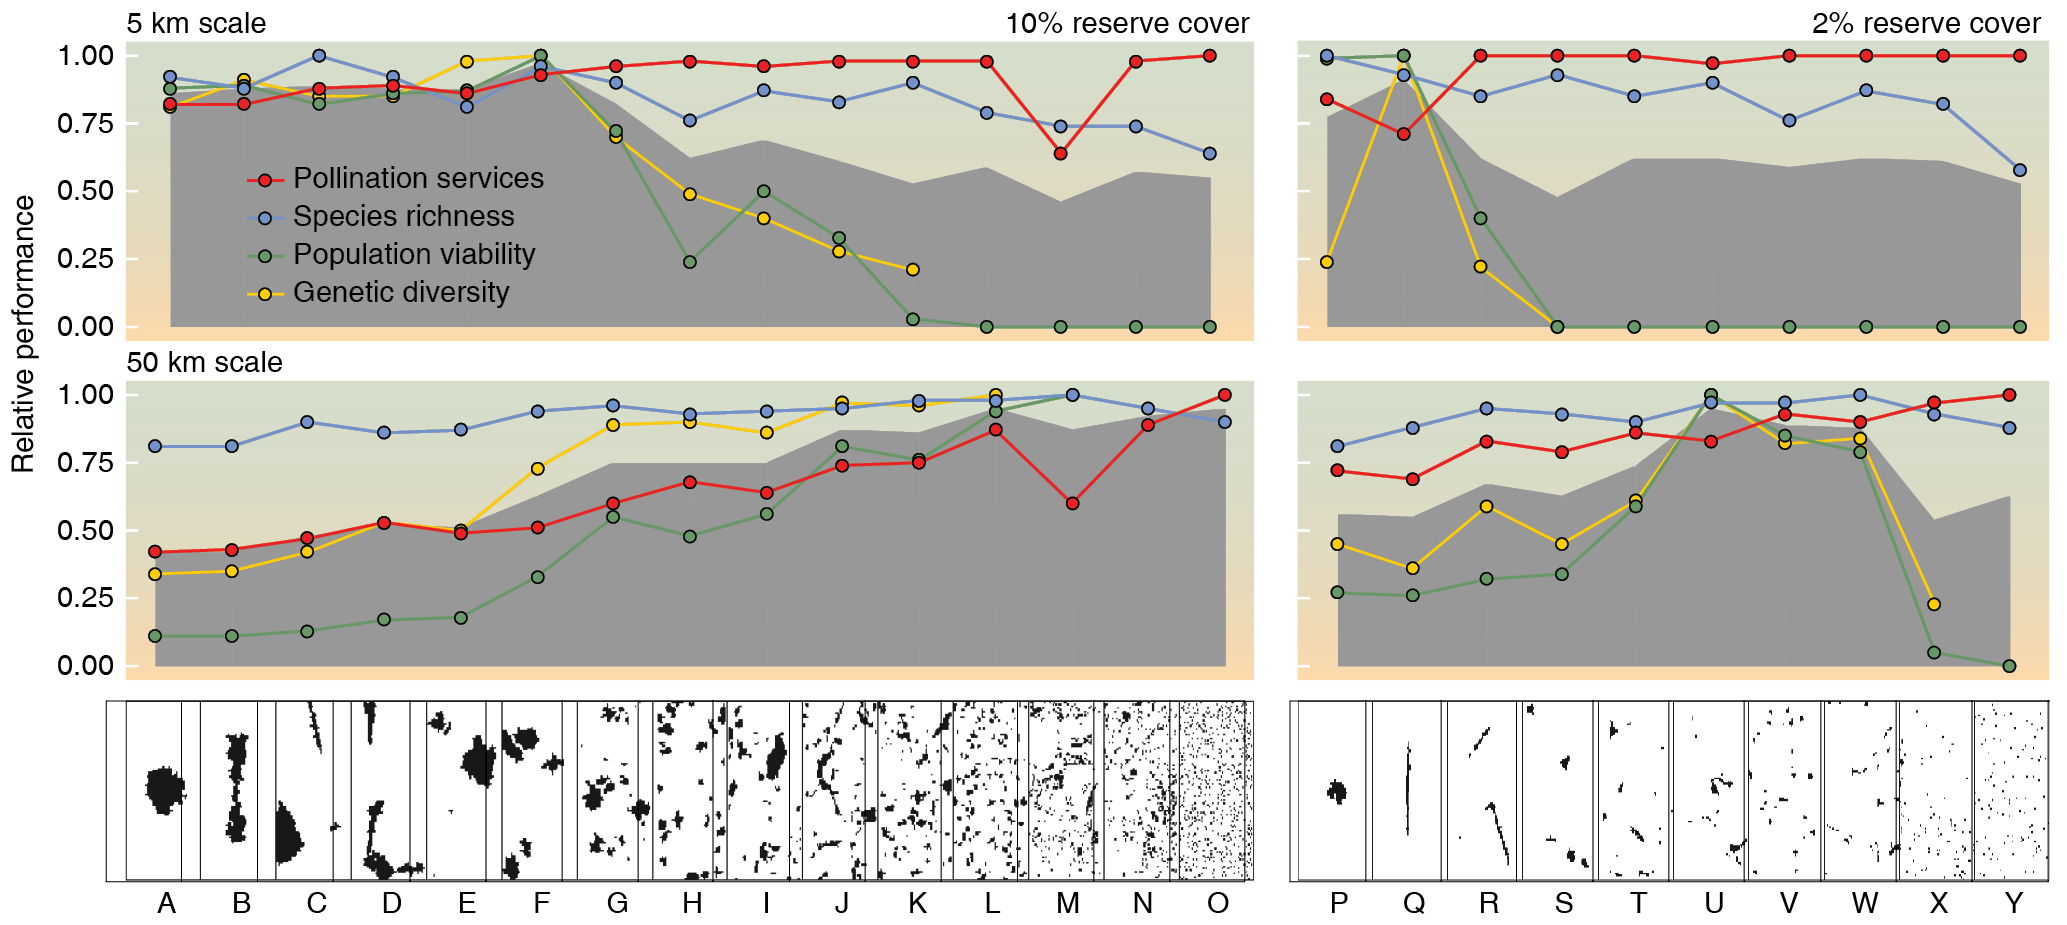
Relative values of four conservation criteria for constrasting scenarios, as assessed by simulation models for landscapes spanning 5 km (top) and 50 km (bottom). Results for scenarios with 10% reserve cover are shown on the left, and for those with 2% coverage on the right. Each of the four panels shows performances relative to the best scenario for each criterion. The grey shading indicates the average value among scores from the four criteria. Values for genetics, population viability and species richness are for mammals (5-km scale) and songbirds (50-km scale). |