|
||
|
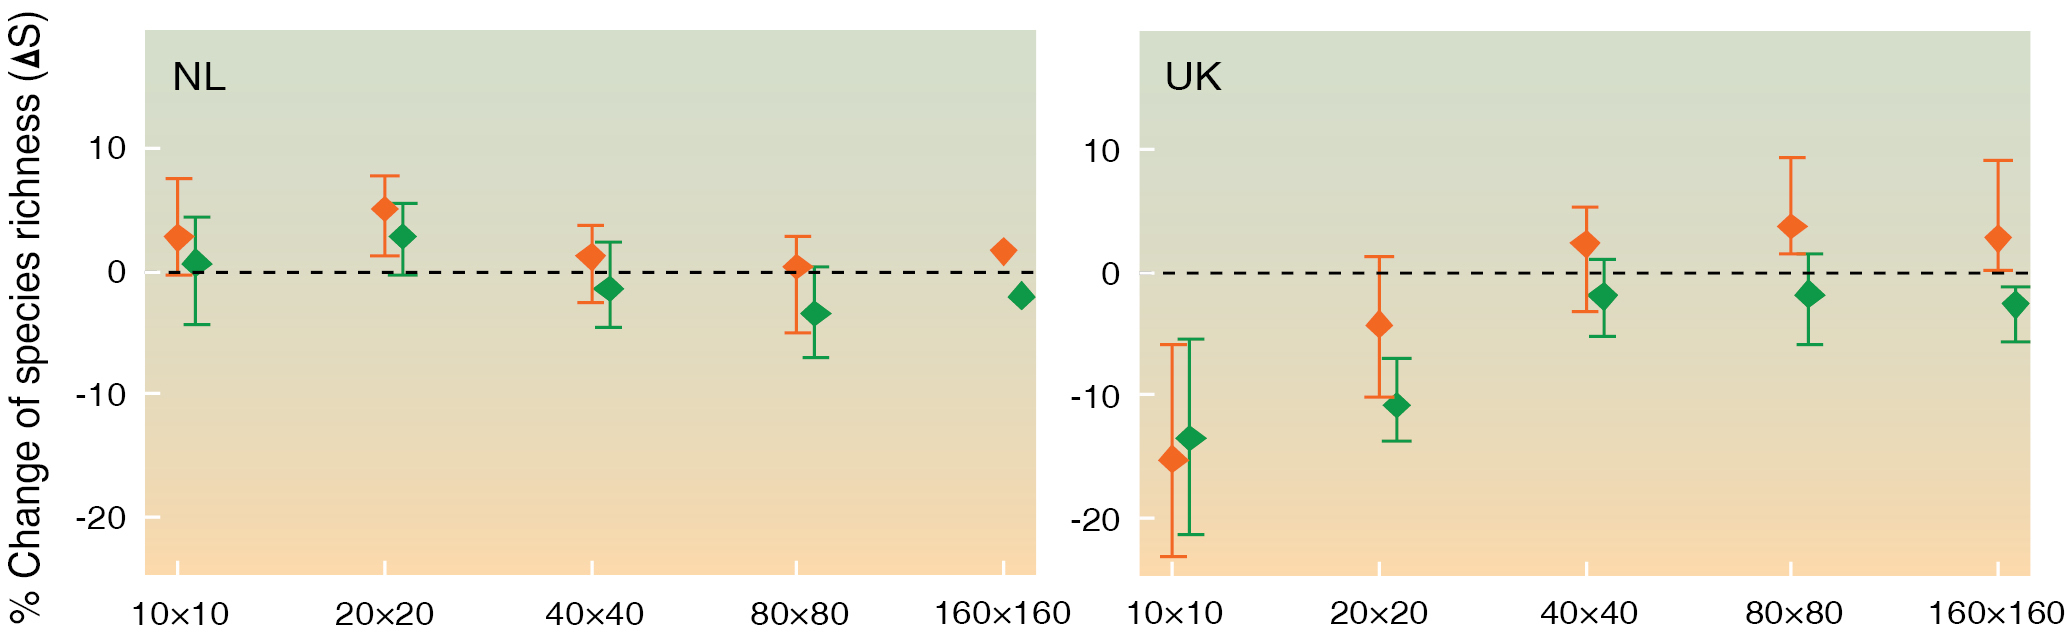
Changes in species richness in hoverflies in the Netherlands (NL) and United Kingdom (UK) at different spatial scales. Orange symbols represent analyses comparing pre- and post 1980 records, while green symbols represent analyses comparing two equal time periods (1954–1979 and 1980–2005). Note that species richness showed signs of increasing in the NL at relatively fine spatial scales, but not at coarser scales, while in the UK substantial fine-scale declines coincide with either no change or even richness increases at coarser scales. |