|
||
|
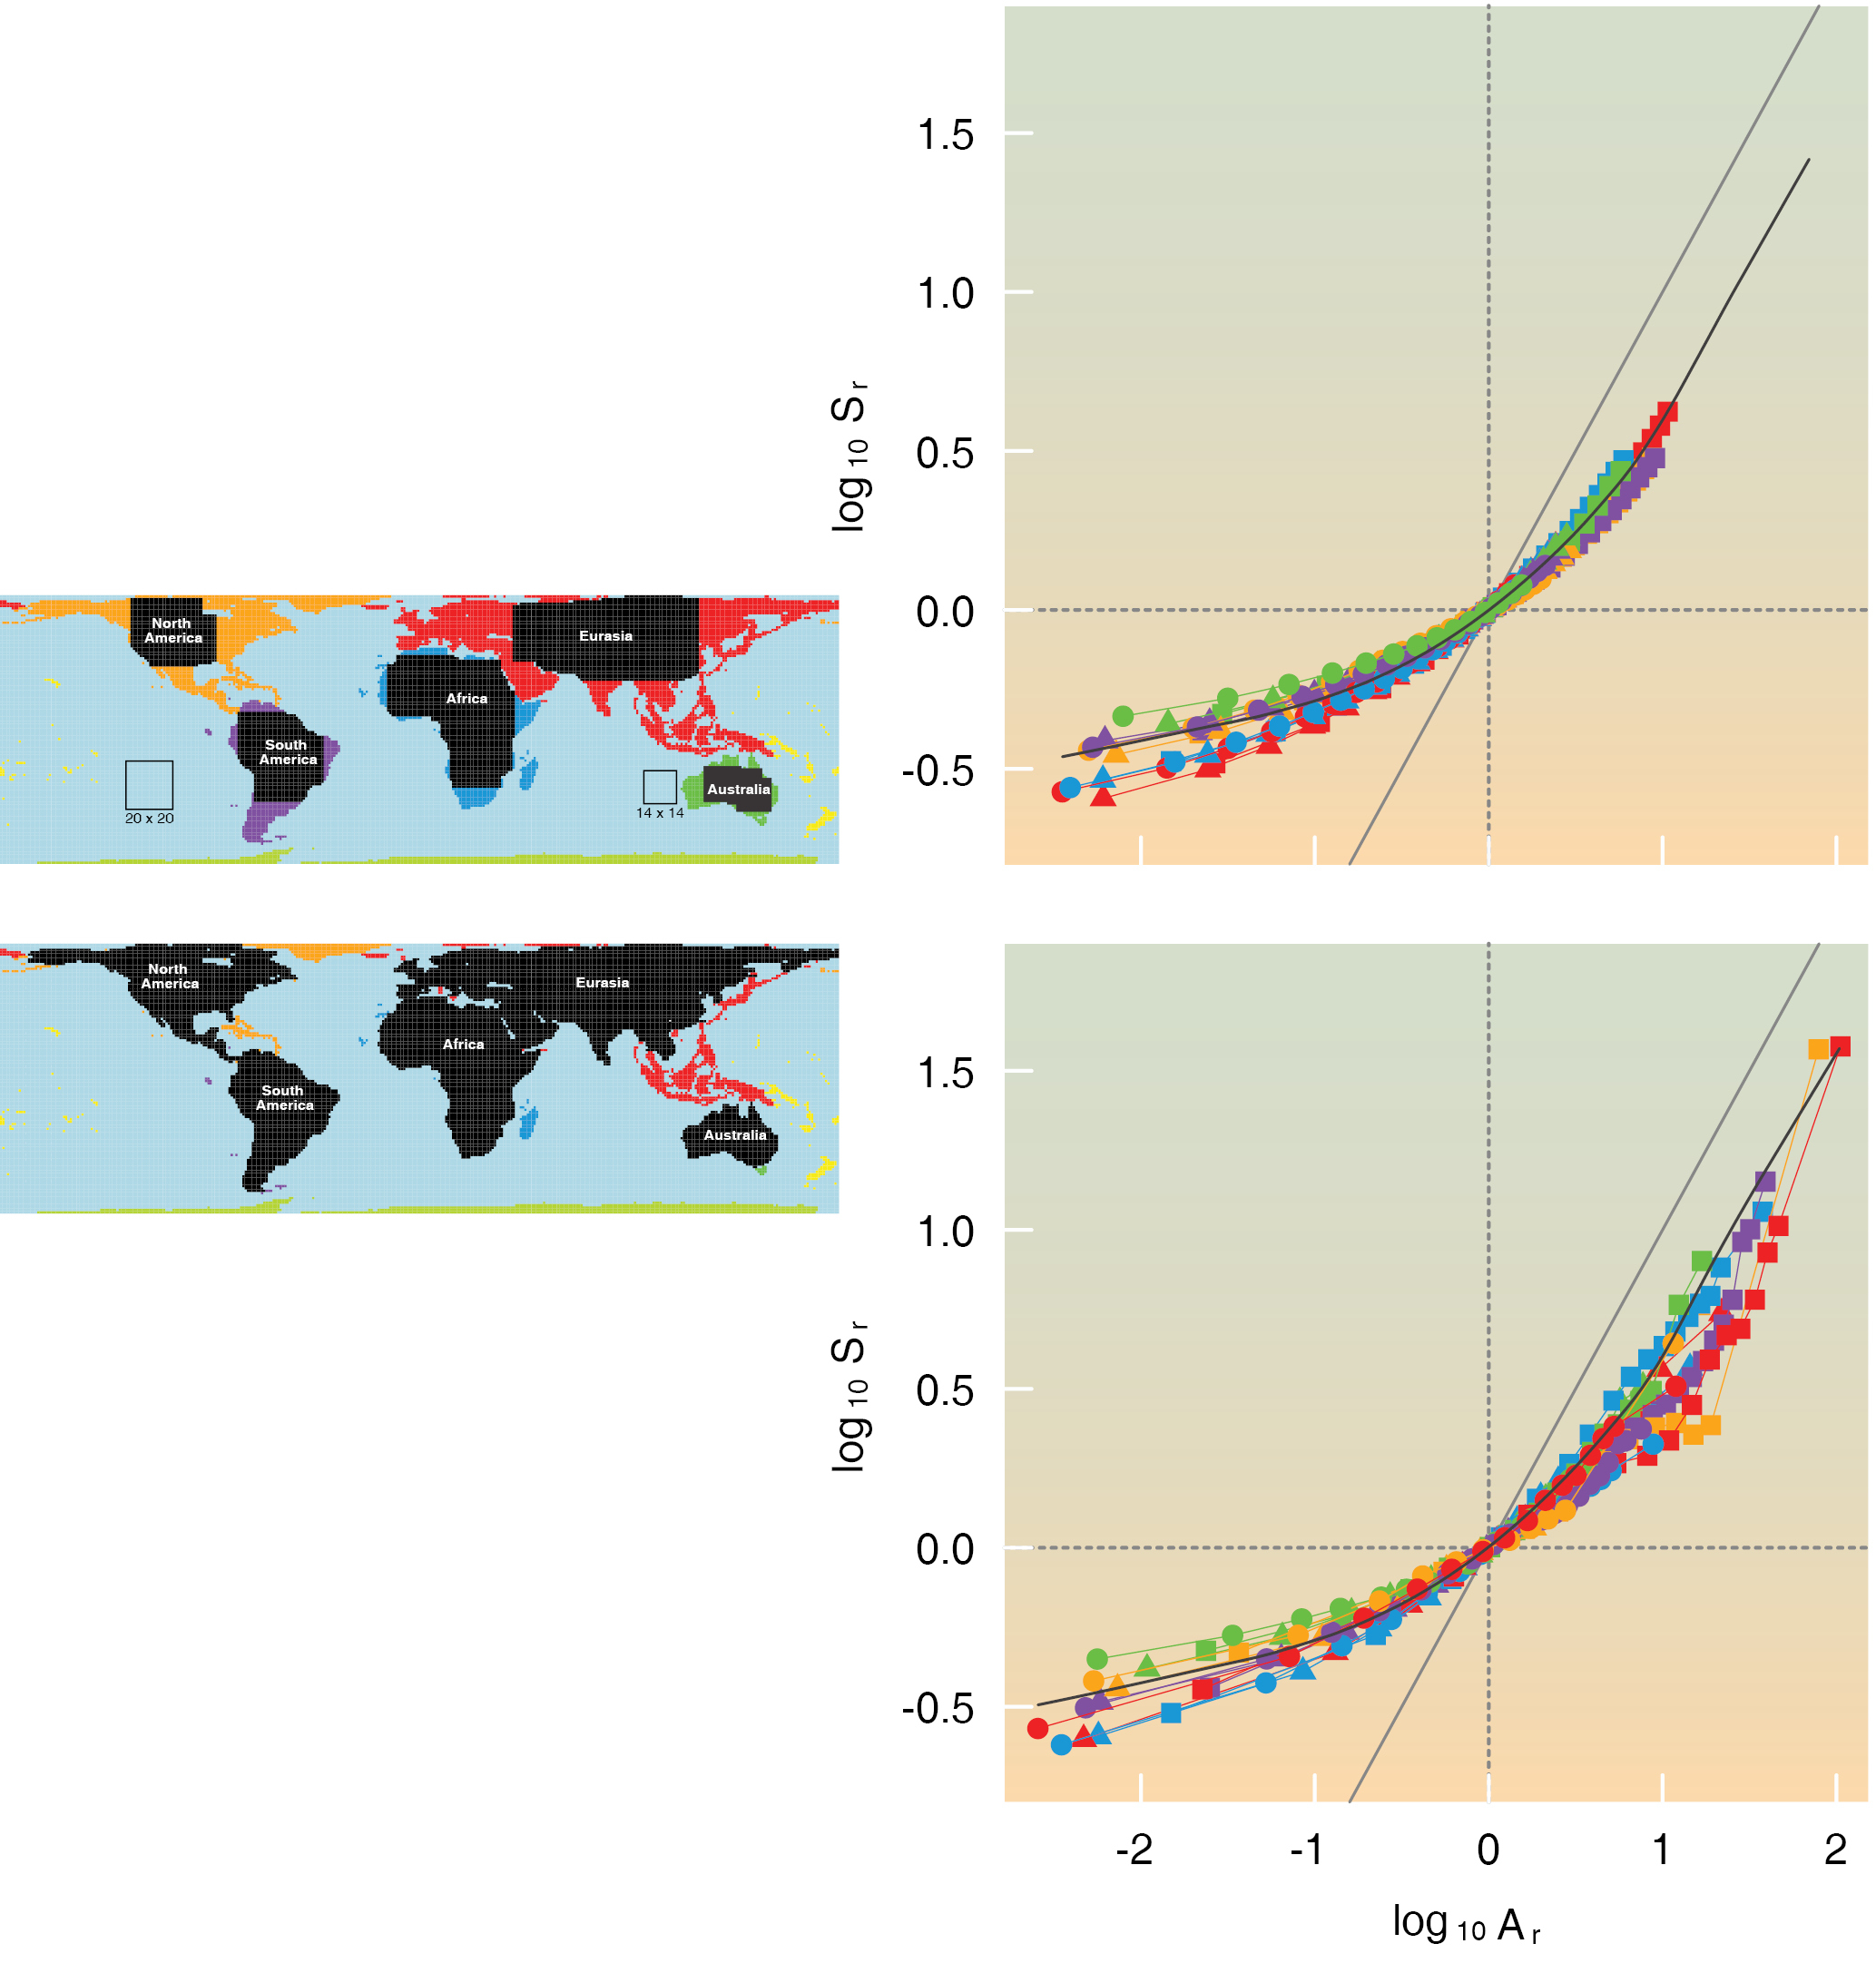
SARs after rescaling for the sampling design based on square sample plots (above) and based on an alternative, continental shape design, in which sample areas are not quadrats but keep the shape of the given continent (below). After expressing the area in units corresponding to mean range size and standardizing the vertical axis so that it represents species richness relative to mean richness for a given unit area, all the SARs collapse into one universal relationship, although some deviations exist, particularly in small areas. Solid black lines refer to rescaled SARs predicted by simulations based on a random placement of simplified ranges. Solid grey lines all have slope of 1. The horizontal axis has been rescaled so that Ar = A/R̄t,c where Ar is the rescaled area, A is the area of the study plot and R̄t,c is the mean range size for taxon t and continent c. Vertical axis represents species richness proportional to the richness of an area equal to R̄t,c, i.e. Sr = SA / SR(t,c), where Sr is the rescaled number of species, SA is mean number of species for a given area, and SR(t,c) and ER(t,c) are mean richness values for the area that equals the mean geographic range size of a given taxon and continent. |