|
||
|
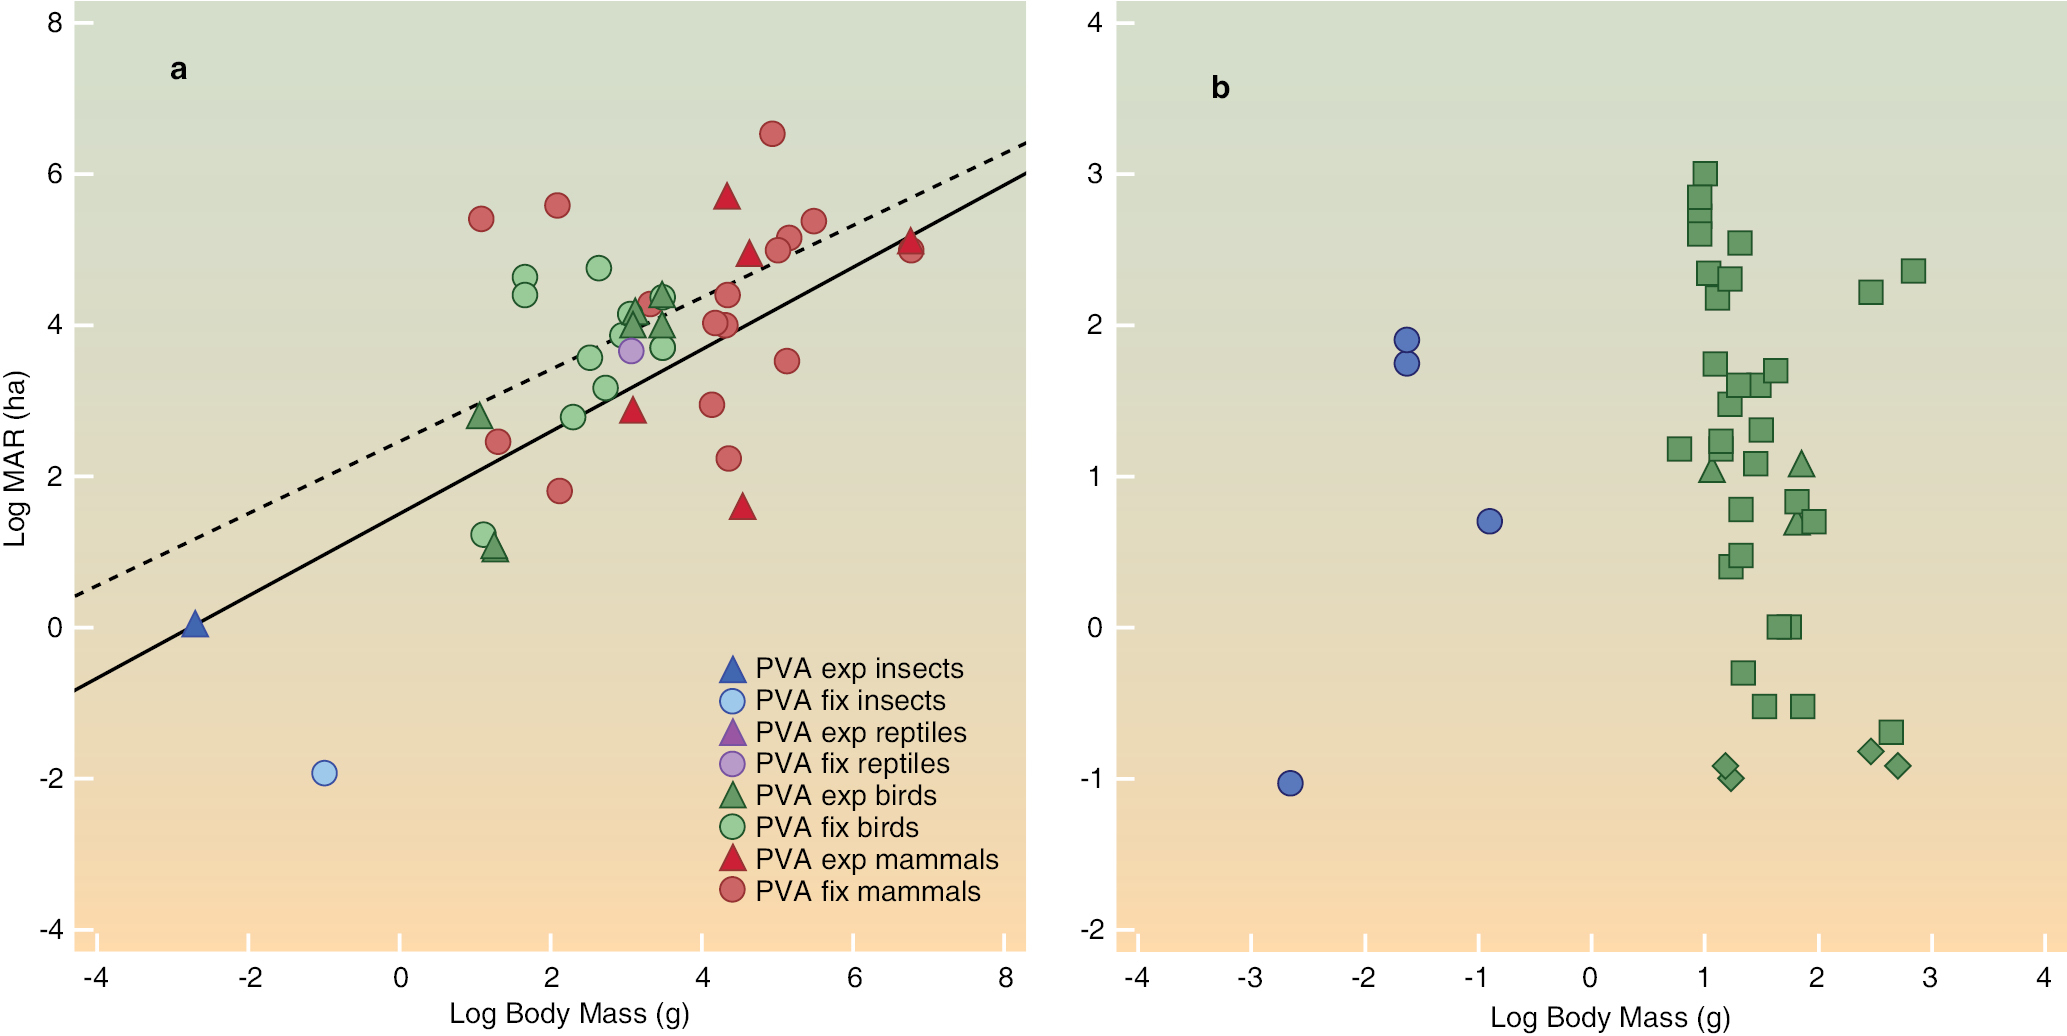
Relationship between the minimum area requirement and body mass based on a) PVA papers and b) empirical studies of occupancy across islands or isolated habitat patches differing in area. PVA studies in (a) are divided into those that explored a range of areas (triangles and darker colours) versus those where authors provided a fixed MAR value, or reported the minimum viable population size (MVP) alongside area-relevant information, such as density, without exploring area (circles and paler colours); Red = mammals; green = birds; blue = insects; purple = reptiles; solid line = PVA exploring area, dashed line = PVA studies reporting a fixed MAR; Shapes in (b) refer to the threshold occupancy value set by authors: diamonds = 30%, squares = 50%, triangles = 80%, circles = 90%; blue = insects, green = birds. Regression lines are provided only for significant relationships. |