|
||
|
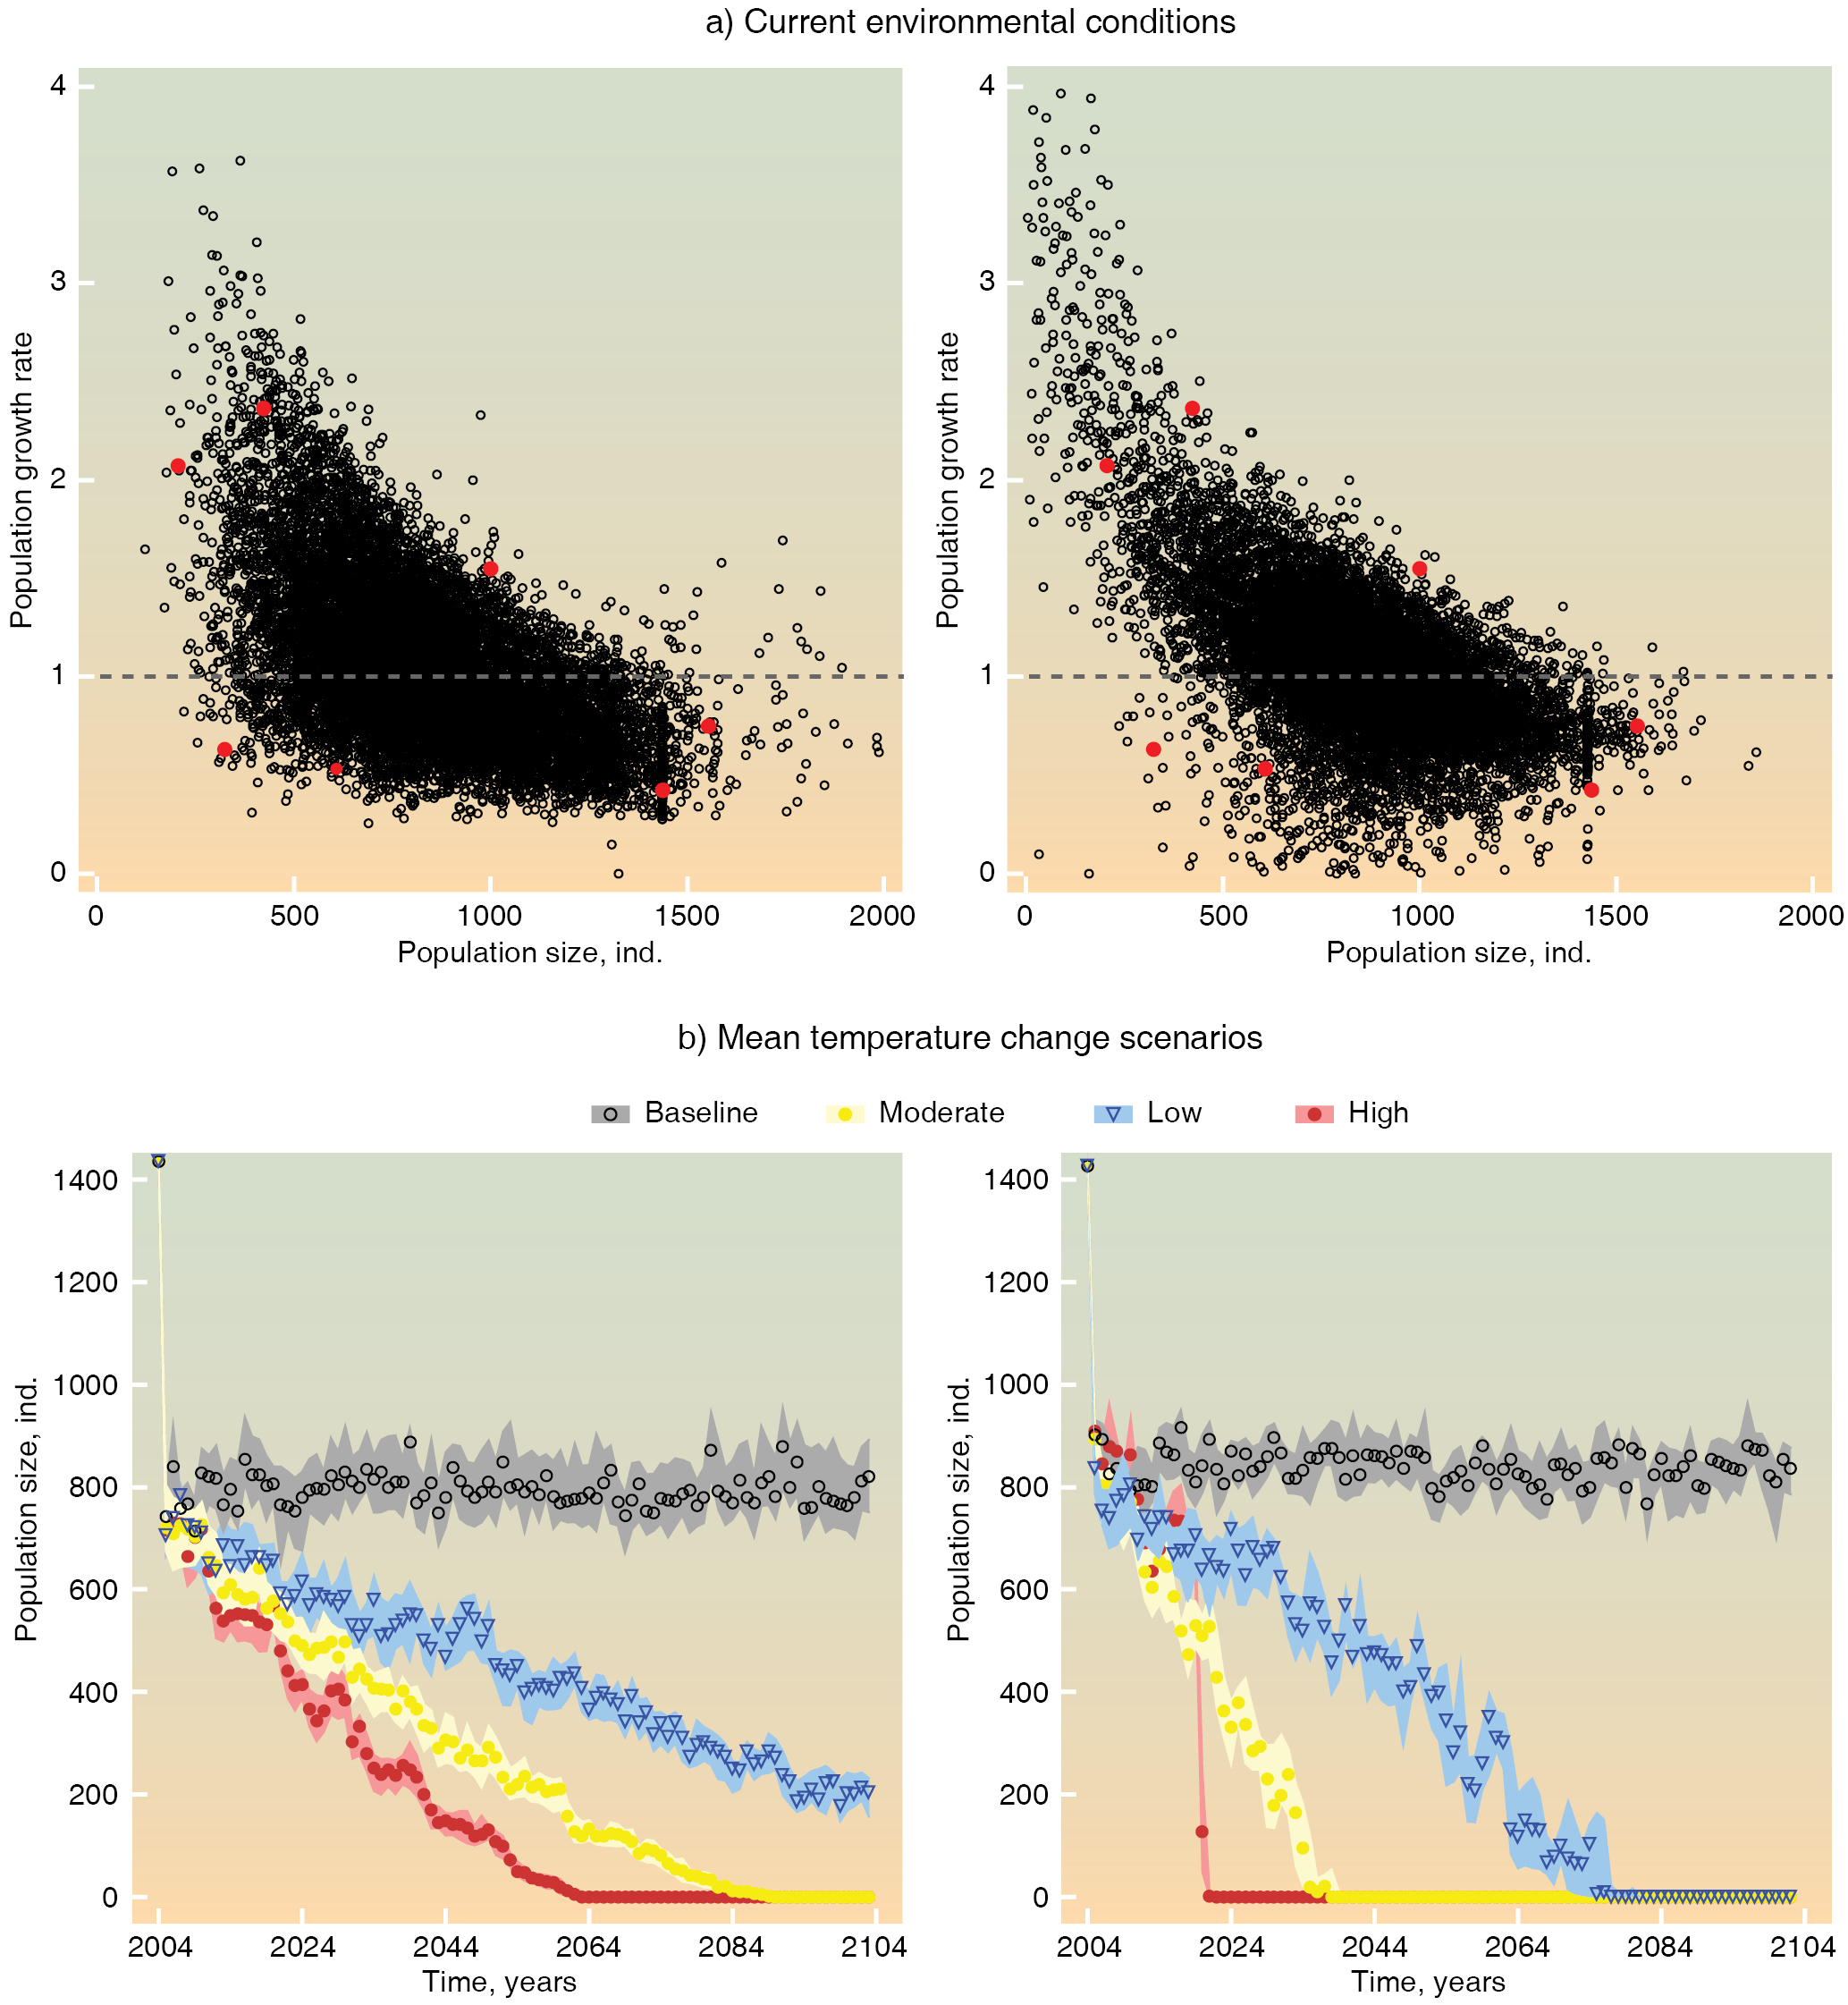
a) Comparison of a yearly stage-based model (left) with a daily, individual-based model (right) in terms of simulated population data (black) versus observed data (red). Both models match well the observed data under current environmental conditions as judged from the plot of population growth rate versus population size. The dashed grey line marks a growth rate of 1 (potentially stable population). b) Comparison of the population dynamics resulting from the two models under three scenarios of change in mean temperatures – small, medium and large. For each year the median population size (and 95% CI) is shown based on 100 simulations. |