|
||
|
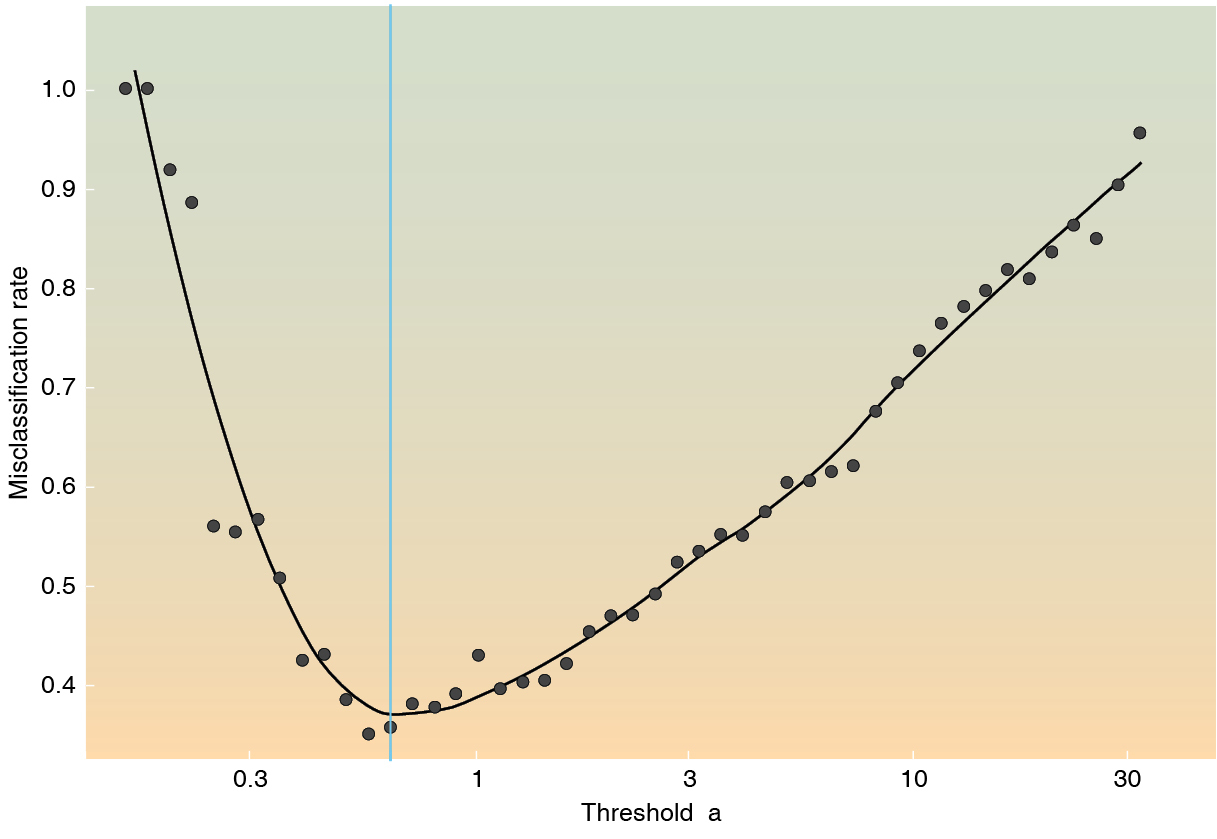
Optimal distinction between small and large α values when all parameters of the range expansion model need to be co-estimated with the environmental heterogeneity. The plot shows the estimated proportion of times where α was incorrectly estimated as below or above a threshold (a given true value). This incorrect assignment is minimized for α=0.63 (blue line), showing a maximal power to distinguish between values of α above and below this value. Here, the misclassification rate is inferred from an analysis of the plot of true (x-axis) vs. estimated (y-axis) α values shown in the central insert. Misclassification rate is obtained as the sum of the proportion of points in the blue regions relative to those in the orange regions on the left and right hand side of the blue line. |