|
||
|
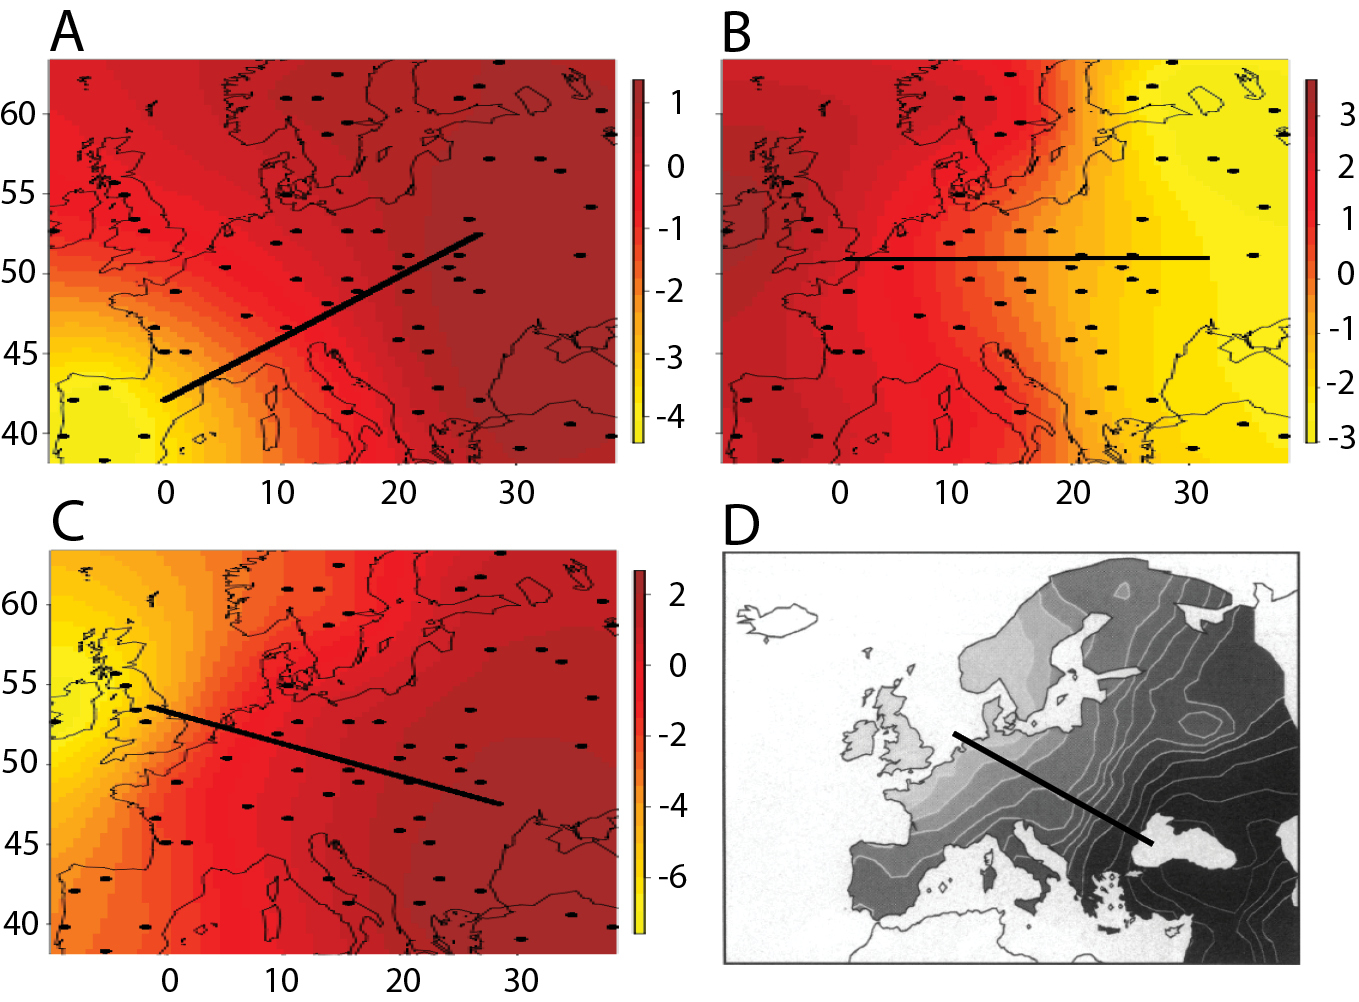
Influence of range contraction on Principal Component (PC) maps. We show the results of Principal Component Analysis (PCA) on Single Nucleotide Polymorphism (SNP) data in the case of a Neolithic range expansions from Middle East resulting in a final population that shows 80% with the pre-existing Paleolithic population: (A) Illustrative example of PCA derived from a range expansion. The PC1 gradient has a SW-NE orientation. (B) Illustrative example of PCA derived from range expansion followed by a range contraction towards all of southern Europe, and subsequent re-expansion. The PC1 gradient has an E-W orientation. (C) Illustrative example of PCA derived from range expansion followed by a range contraction towards the Iberian Peninsula only, and subsequent re-expansion from this refugium. The PC1 gradient has an NW-SE orientation. (D) Original PC1 map inferred from Piazza et al. (1995) [© 1995 National Academy of Sciences, USA] with a superimposed line connecting positive and negative PC1 centroids. The PC1 gradient shown in (C), which is the most similar to real data (D), was also found in scenarios with a larger Paleolithic contribution and either pure range expansions or range expansions with range contraction towards the Iberian Peninsula (see Arenas et al. 2013 for further details). |