|
||
|
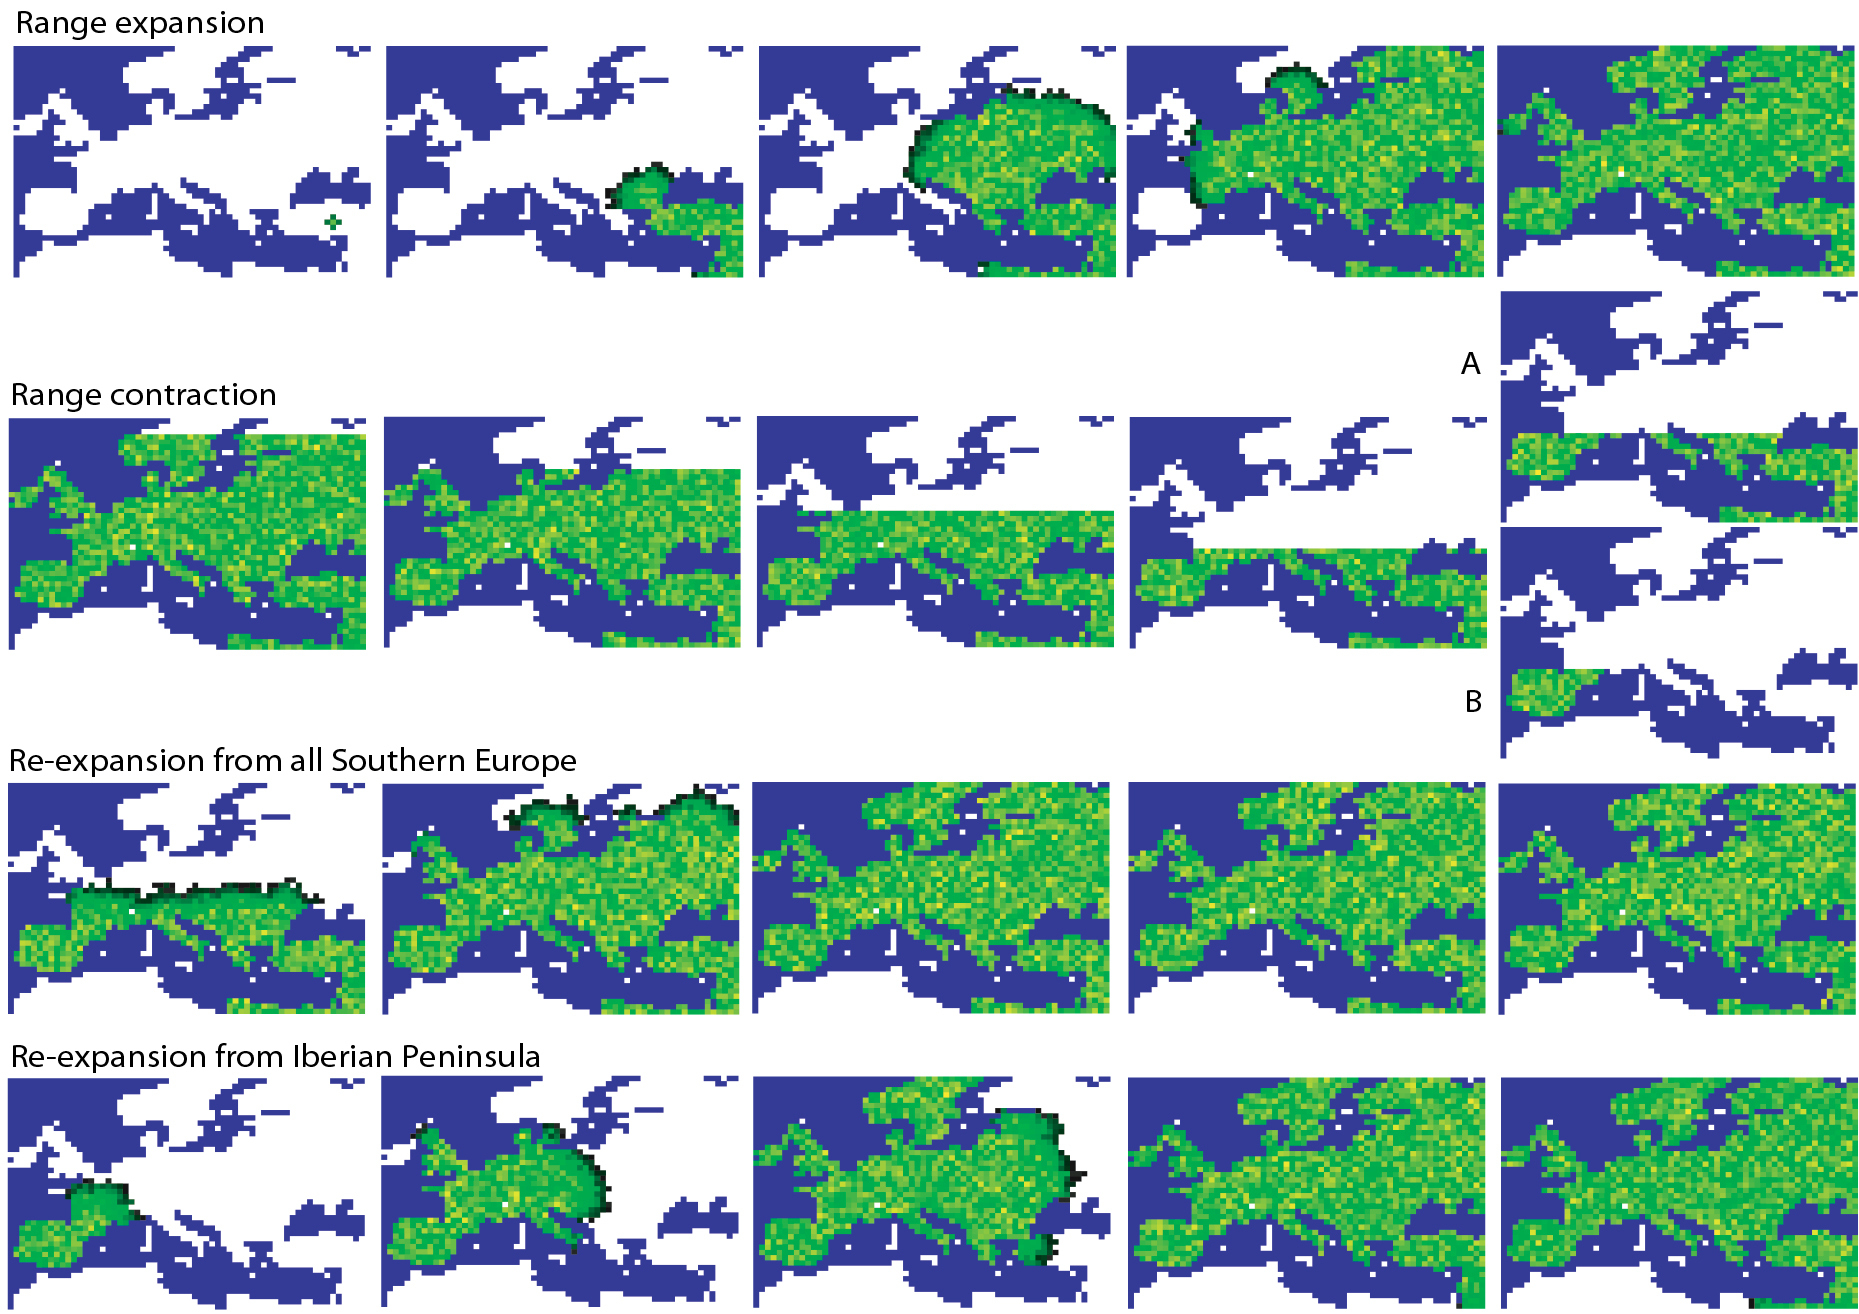
Timeline simulation of complex scenarios of range expansion, range contraction and posterior re-expansion. Each plot corresponds to a snapshot of the program SPLATCHE2. White areas indicate unoccupied demes while green areas represent occupied demes. Snapshots presented at each line differ in 50 generations, see detailed settings in Arenas et al. (2013). At the top, we describe a range expansion over Europe from the Near East. Then, we show a range contraction from the north to the south, which mimic the Last Glacial Maximum period and leads to two situations (as shown on the left of the second row: A: refuge areas cover all southern Europe, and B: there is a single refugium in the Iberian Peninsula. The third and fourth rows show a re-expansion from these two types of refuge areas. |